Morgan Stanley identifies next wave of AI-linked "alpha"

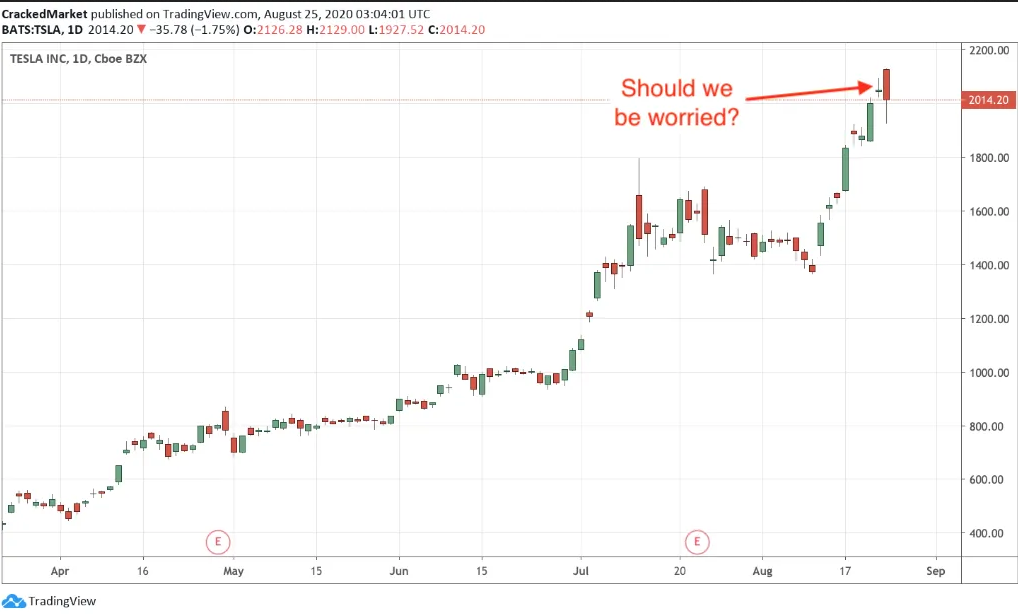
Tesla (NASDAQ:TSLA) popped at the open yesterday and gapped to all-time highs above $2,100. Unfortunatly, that was as good as it got because minutes later, agressive selling slashed nearly 10% off those lofty highs. But rather than devolve into a truly dreadful bloodbath, dip buyers raced in and reclaimed a big portion of those losses. By the end of the day, the stock managed to close back above the psychlogically significant $2K level.
Good day, bad day, or mixed signals? By all rational accounts, it is impossible to classify a 10% intraday crater as a good thing. But at the same time, the fact such a shocking move didn’t trigger wider selling tell us many owners are not afraid of a little (or a lot!) of volatility and are confidently waiting for higher prices “no matter what.” That limited the damage and dip buyers were able to pick up the pieces and get the stock to close well above those initial lows.
Some bad, stir in some good and that leaves us with a mixed day. And as is usually the case, we cannot read too much into a single day’s price action. Yesterday's activity was definitely a signal to pay attention to, but unless it is followed up by other cautionary moves, the previous trend higher remains fully intact.
As I wrote last week, this stock is extremely frothy and what goes up this fast, comes down even faster. As long as this stock remains above $2K, it is ownable, but anytime it falls under $2K, proceed with extreme caution. Monday’s $200 tumble could easily turn into $300 or $500 before we know what hit us.
I love trading bubbles, but that also means knowing when to get out. Way too many people are going to ride this all the way up and then hold it all the way down. It happens every…single…time. Don’t be one of those people. Have a plan to protect your profits and then when everyone else is crying about the next TSLA tumble, you will be there with a pile of cash, ready to buy the next dip. But you have to get out first before you can do to do that.
And you know what, if we get out too soon, we can always jump back in. The nimblenss of our size if the greatest ability of being an independent trader. Remember, we only make money when we sell our winners. Buy TSLA above $2k and sell it under $2k. If we get tossed around in some whipsaws, no big deal. It sure beats holding a huge crash or missing out on the next pop.
Which stock should you buy in your very next trade?
With valuations skyrocketing in 2024, many investors are uneasy putting more money into stocks. Unsure where to invest next? Get access to our proven portfolios and discover high-potential opportunities.
In 2024 alone, ProPicks AI identified 2 stocks that surged over 150%, 4 additional stocks that leaped over 30%, and 3 more that climbed over 25%. That's an impressive track record.
With portfolios tailored for Dow stocks, S&P stocks, Tech stocks, and Mid Cap stocks, you can explore various wealth-building strategies.

