Stocks traded higher yesterday, with the S&P 500 rising by 1.6%, and it is getting close to those November 9 intra-day highs. That is likely the next major level of resistance until I have to start digging around to figure out what is next.
If this recent downturn from November 9 until November 20 was wave 4, then it likely means we are now in wave 5, and that means new highs are coming, and the pullback to 3350 is not in the cards for now. If we do clear the high around 3,665 on the S&P 500 futures, the next level I would look for is around 3,710.
Unfortunately, I won’t know for sure until we reach 3,665. Perhaps that happens tonight while I’m sleeping, or it won’t. The RSI is currently at 65.5, which means it could rise some more as well. Meanwhile, the Bollinger® bands give us room for higher prices too.
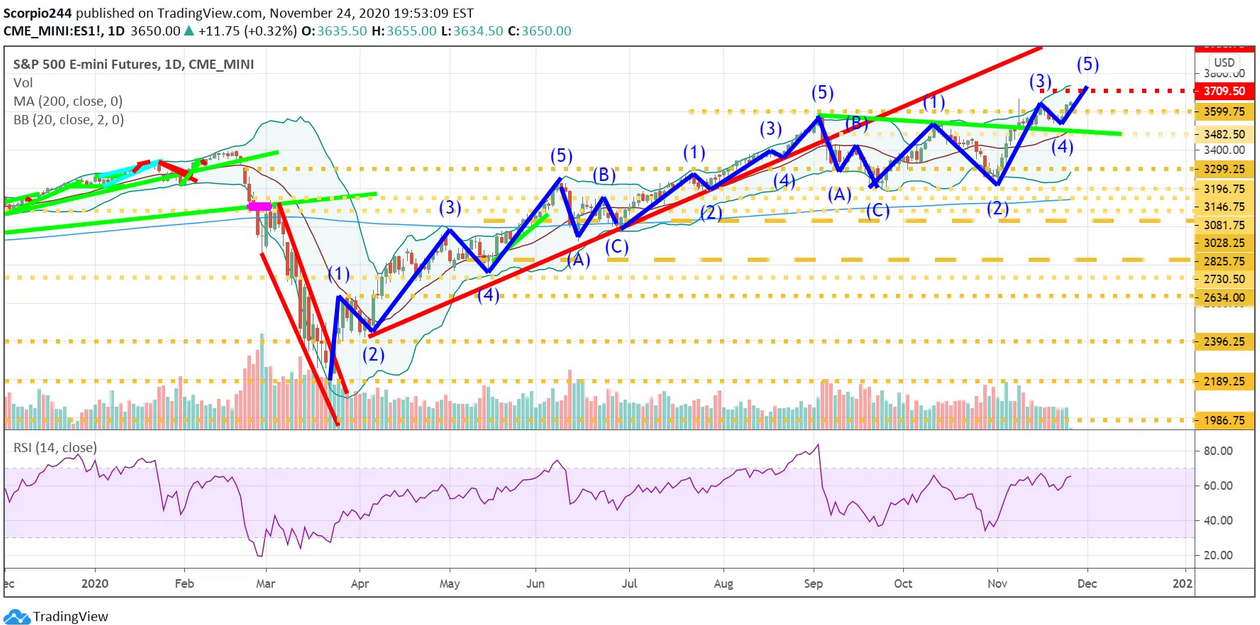
Wave 4 should have been steeper, but it wasn’t; we move on. If we fail at 3,665, we could still get the steeper drop I was expecting. Unfortunately, I try not to give you a double-sided thought process; to cover my ass; I try to give what I actually think. Sometimes I look like a genius; sometimes, I don’t.
Square
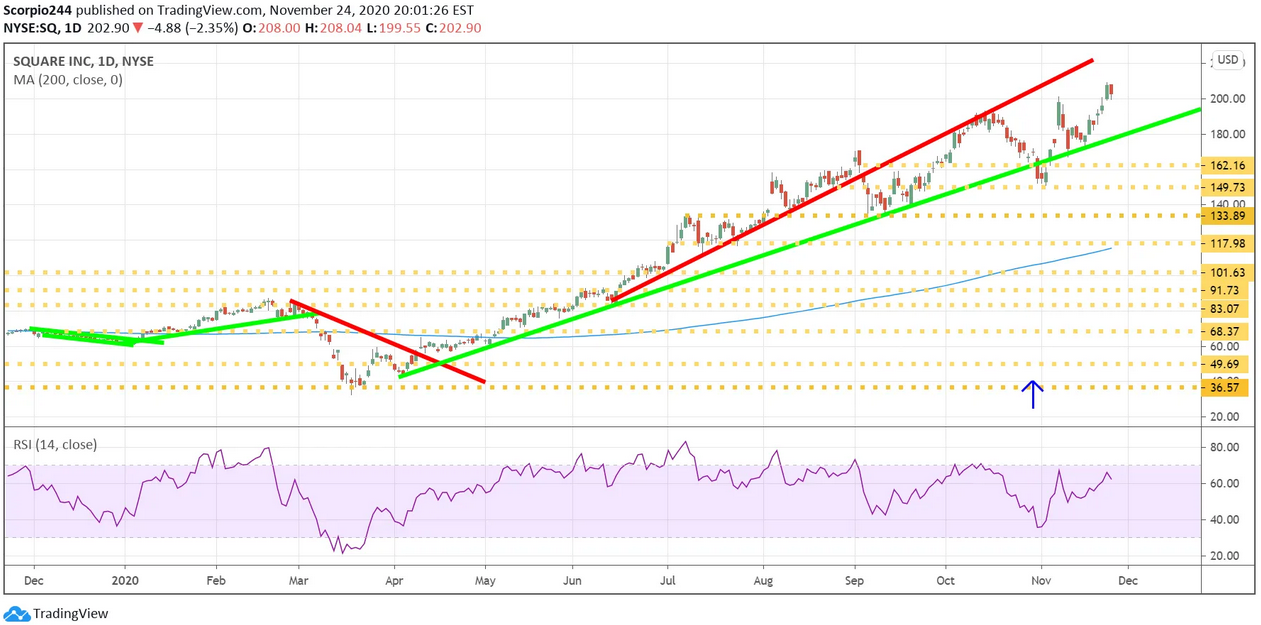
Square (NYSE:SQ) is up 540% since the March lows, think about that. It is crazy, you’d think they cured something, but they didn’t. Even Moderna (NASDAQ:MRNA) isn’t up that much, and from the sound of it, they did actually cure something, like COVID. Hey, I’m not knocking Square, a great concept, but the stock is nuts.
It is stupid, is it what it is. Hey, but if you think the best is yet to come for the stock, then good luck.
NVIDIA
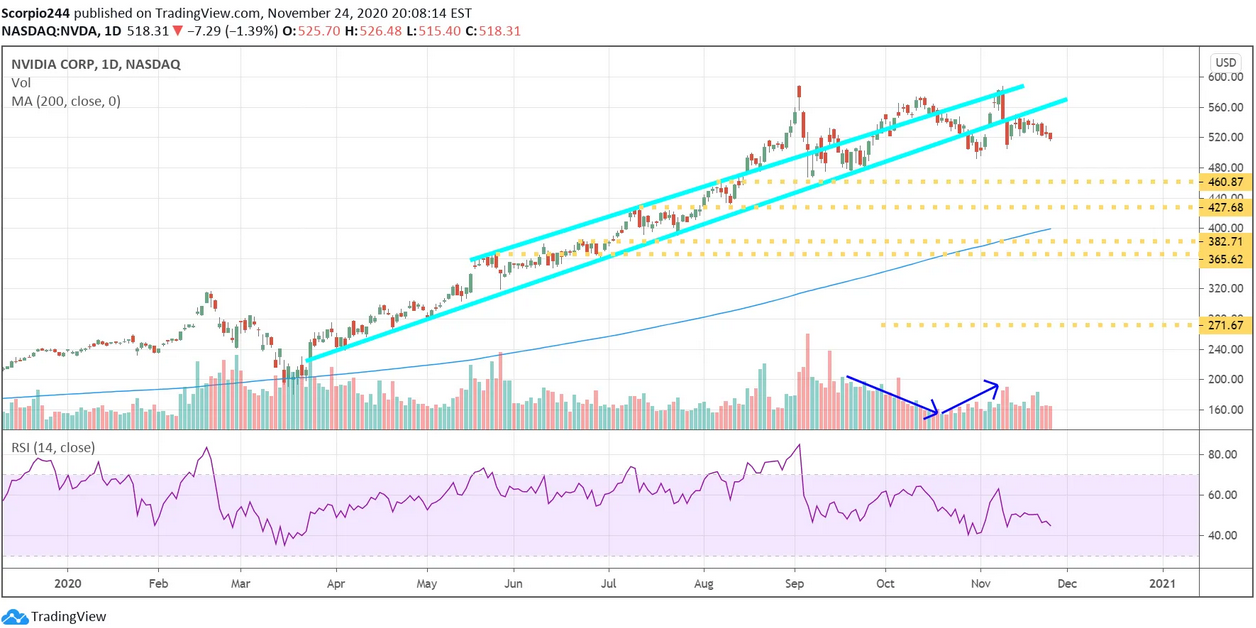
It has gotta suck to have NVIDIA Corporation (NASDAQ:NVDA) with the stock down over 1% yesterday, with everything else ripping. But hey, another example of a stock that is very expensive, that now grows through acquisition. Imagine how much it would have been down if the market went down. There is still that nice double top pattern potentially lurking.
Wells Fargo
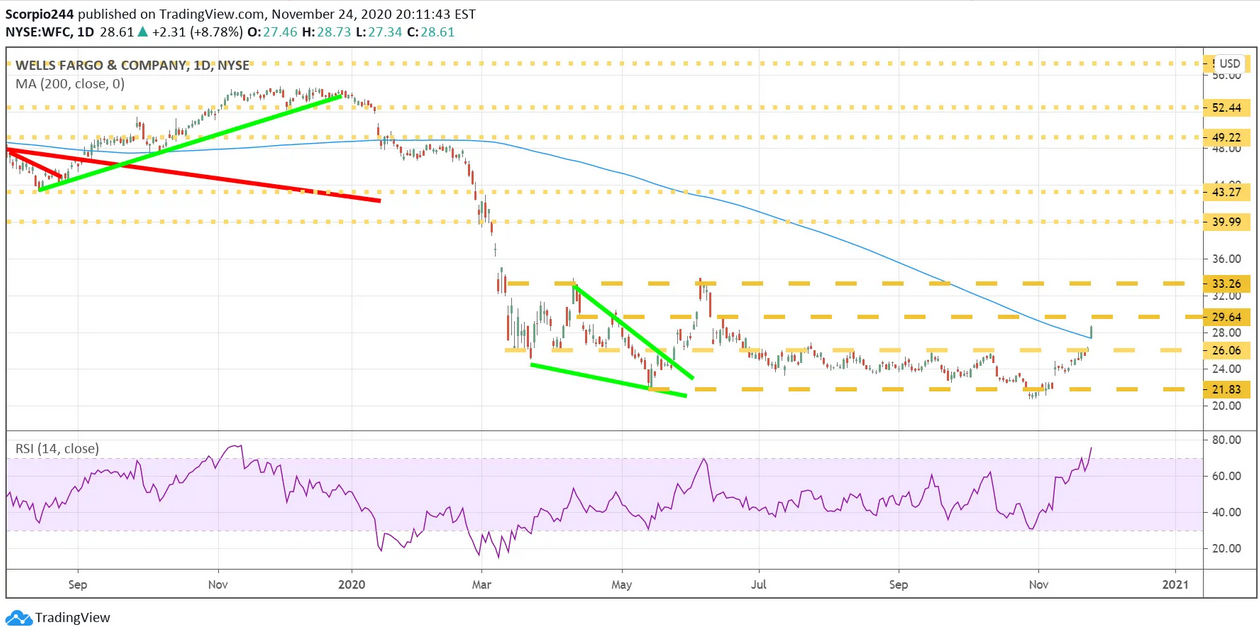
You can add Wells Fargo & Company (NYSE:WFC) to the list of stocks now above their 200-day moving average. The stock was up nearly 9% yesterday, wow. It got a double upgrade from RaJa, to outperform from underperform, with a $32 price target.
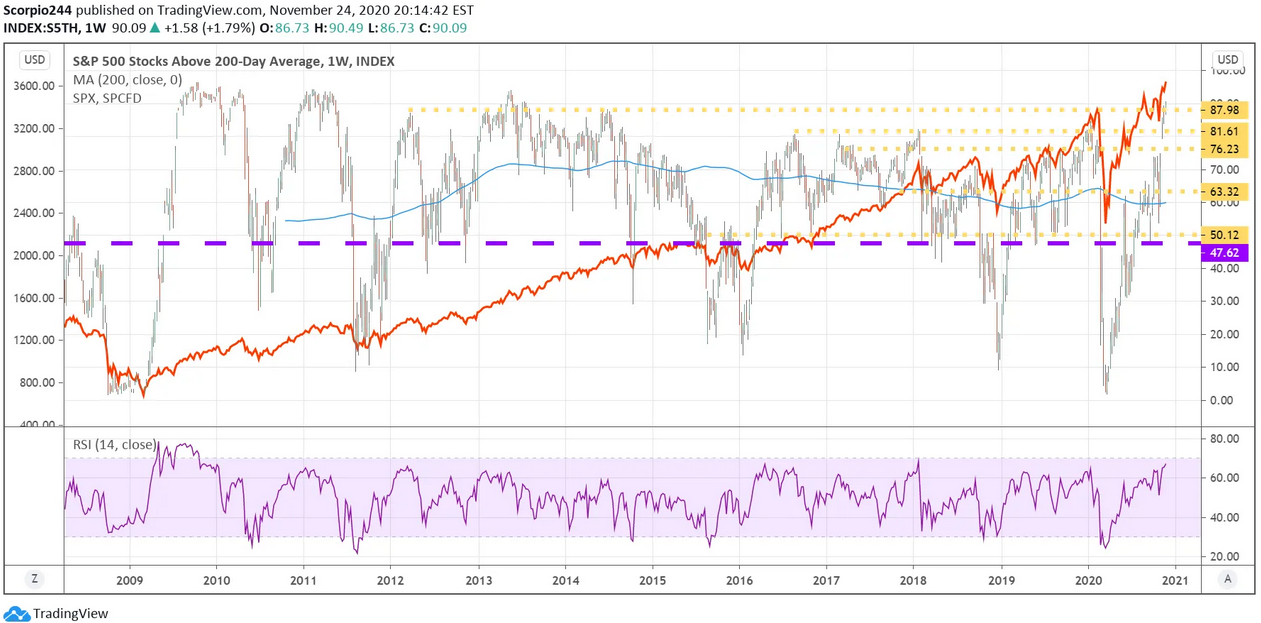
Speaking of the number of stock above their 200 moving average, that is now more than 90%. Could it go higher, sure, 10 more percentage points.
Which stock should you buy in your very next trade?
With valuations skyrocketing in 2024, many investors are uneasy putting more money into stocks. Unsure where to invest next? Get access to our proven portfolios and discover high-potential opportunities.
In 2024 alone, ProPicks AI identified 2 stocks that surged over 150%, 4 additional stocks that leaped over 30%, and 3 more that climbed over 25%. That's an impressive track record.
With portfolios tailored for Dow stocks, S&P stocks, Tech stocks, and Mid Cap stocks, you can explore various wealth-building strategies.


