Germany has been the rock of the European economy and many think their backing is the only thing holding the euro together. It stands to reason then that the troubles in Greece, Spain….all of the Continent, would be a drag on their markets. What do the charts say about that happening?
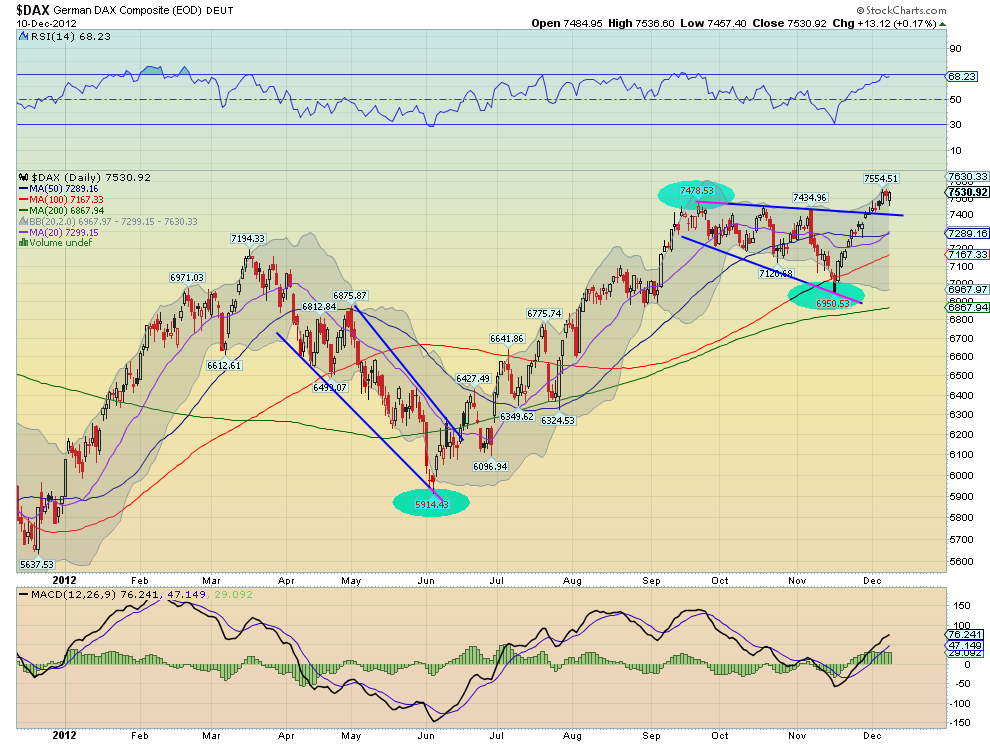
Not so much. The daily chart below shows a bullish pattern, breaking out of the expanding wedge higher. The target from the wedge break takes it to 7950. But there is another pattern working on this timeframe. 
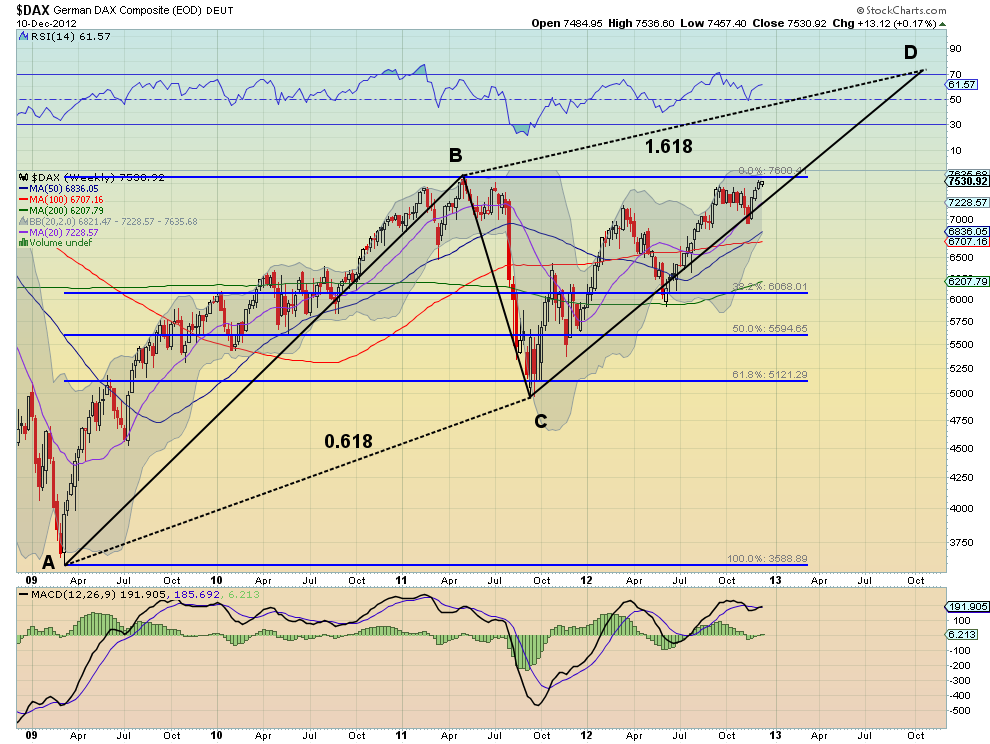
The move from the June low to the September high is nearly identical to the previous move from December 2011 to March. Looking at a similar Measured Move higher from the November low creates a target of 8510. But the picture gets better on the longer weekly timeframe. The 4 year chart shows a nearly perfect bearish Harmonic AB=CD pattern forming.
Yes, I said bearish but the the Potential Reversal Zone (PRZ) has a range higher for point D between 8971 and 9231 and should be about October 2013. With the top at 7600 from May 2011 only 70 points away as the last obstacle, and a bullish and rising Relative Strength Index (RSI) and Moving Average Convergence Divergence indicator (MACD) that has turned positive and is growing supporting it, there seems little danger of a failure to move to new highs.
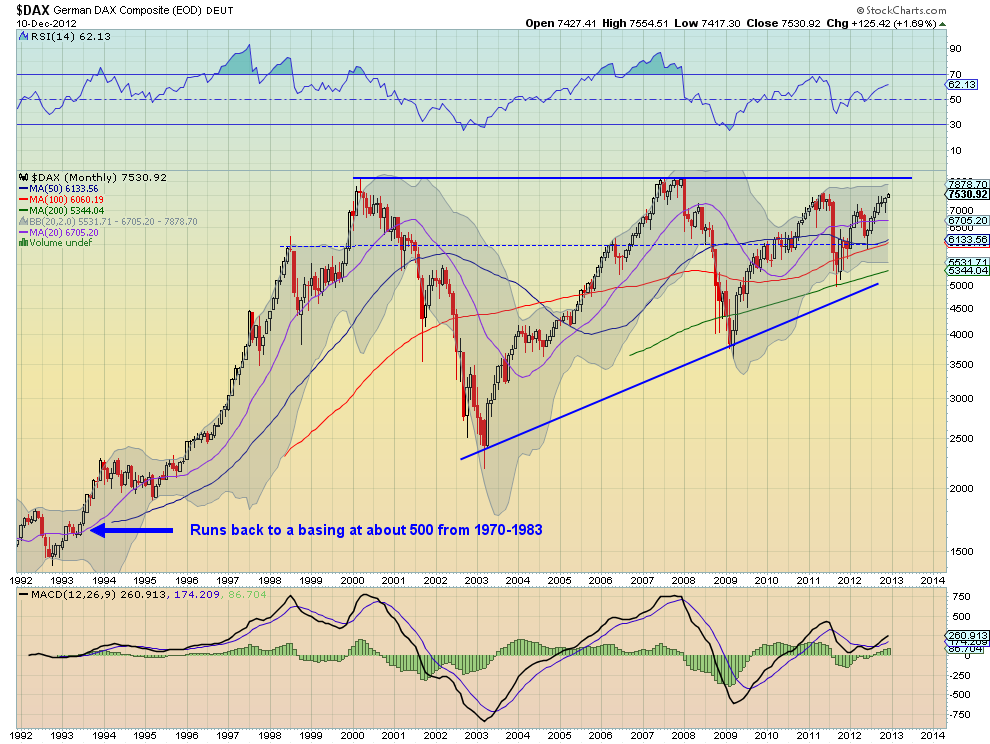
But we're just getting warmed up. The monthly chart below prominently shows an ascending triangle over the last 13 years with the top rail at 8150. Even though that is over 600 points higher, the shorter views show it could easily get there. A move over the top of the triangle carries a target of 13,900. Crazy town? 
Maybe, but this market looks bullish not matter where you are looking from. So in summary the short run shows a strong chart breaking out with a target of 7950 and over that 8510. Those give weight to the intermediate term view that shows a PRZ between 8971 and 9231. Both of these take the monthly chart over the top rail and then trigger a target of 13,900. Seems like Germany is the place to be.
Disclosure: The information in this blog post represents my own opinions and does not contain a recommendation for any particular security or investment. I or my affiliates may hold positions or other interests in securities mentioned in the Blog, please see my Disclaimer page for my full disclaimer.
Original post
Which stock should you buy in your very next trade?
With valuations skyrocketing in 2024, many investors are uneasy putting more money into stocks. Unsure where to invest next? Get access to our proven portfolios and discover high-potential opportunities.
In 2024 alone, ProPicks AI identified 2 stocks that surged over 150%, 4 additional stocks that leaped over 30%, and 3 more that climbed over 25%. That's an impressive track record.
With portfolios tailored for Dow stocks, S&P stocks, Tech stocks, and Mid Cap stocks, you can explore various wealth-building strategies.
