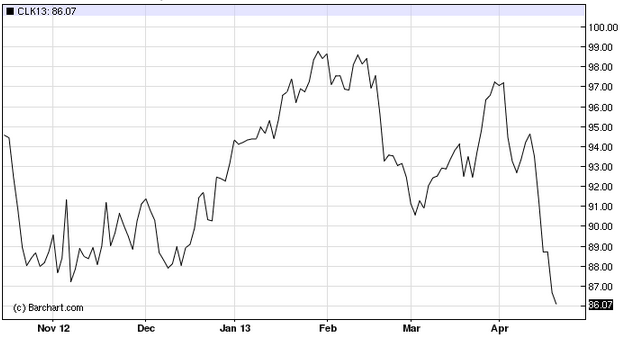
In the theme of bearish sentiment in commodity markets, crude oil came under severe pressure recently. Based on today's data, U.S .crude inventory actually declined last week, surprising some forecasters who expected crude stocks to continue rising. One would expect lower inventories to result in higher prices, but that did not occur.

Instead WTI futures took a 2% hit today, reaching a 10-month low.

Here are some of the explanations from market participants for these violent moves to the downside:
1. Weaker than expected growth in China precipitated a negative sentiment in commodity markets.
2. Major commodity investors such as hedge funds have been unwinding positions.
3. On Wednesday we saw what could amount to weaker than expected demand for gasoline in the U.S., as more drivers stay home.
EIA: - Over the last four weeks, motor gasoline product supplied has averaged over 8.4 million barrels per day, down by 3.3 percent from the same period last year.
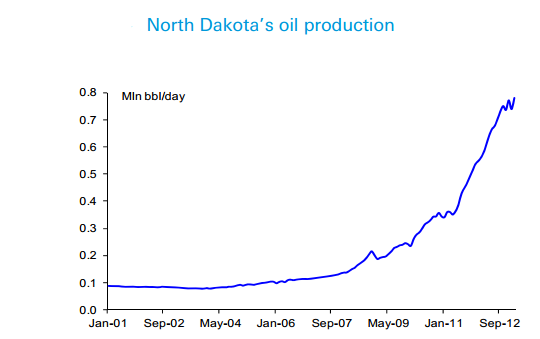
4. The non-OPEC crude oil production, particularly out of North America continues to surprise. The Deutsche Bank chart below, showing North Dakota's oil production, is giving some long oil investors a pause for concern (in some cases nightmares).

DB: - The latest production data out of North Dakota, home to the prolific Bakken shale, reflects the strength of U.S. production. Output hit a record 780kbd in February, after dipping in January as cold weather hindered operations. Production in the state is up nearly 40% YTD. According to Lynn Helms, Director of North Dakota’s Department of Mineral Resources, the state is likely to reach 800kbd in May once weather conditions improve. Helms also said the state is on track to reach production of 850kbd by early 2014. Note that if North Dakota’s production averages about 800kbd this year, which would be up from last year’s average production rate of 663kbd, it would equal over 70% of non-OPEC’s estimated total supply growth for this year, according to the IEA.
All this is good news from the Fed's perspective, giving the central bank incremental room for monetary expansion. It's unclear where the Fed-induced bubble will show up, but for now it's not in commodities.

Instead WTI futures took a 2% hit today, reaching a 10-month low.

Here are some of the explanations from market participants for these violent moves to the downside:
1. Weaker than expected growth in China precipitated a negative sentiment in commodity markets.
2. Major commodity investors such as hedge funds have been unwinding positions.
3. On Wednesday we saw what could amount to weaker than expected demand for gasoline in the U.S., as more drivers stay home.
EIA: - Over the last four weeks, motor gasoline product supplied has averaged over 8.4 million barrels per day, down by 3.3 percent from the same period last year.
4. The non-OPEC crude oil production, particularly out of North America continues to surprise. The Deutsche Bank chart below, showing North Dakota's oil production, is giving some long oil investors a pause for concern (in some cases nightmares).

DB: - The latest production data out of North Dakota, home to the prolific Bakken shale, reflects the strength of U.S. production. Output hit a record 780kbd in February, after dipping in January as cold weather hindered operations. Production in the state is up nearly 40% YTD. According to Lynn Helms, Director of North Dakota’s Department of Mineral Resources, the state is likely to reach 800kbd in May once weather conditions improve. Helms also said the state is on track to reach production of 850kbd by early 2014. Note that if North Dakota’s production averages about 800kbd this year, which would be up from last year’s average production rate of 663kbd, it would equal over 70% of non-OPEC’s estimated total supply growth for this year, according to the IEA.
3rd party Ad. Not an offer or recommendation by Investing.com. See disclosure here or remove ads.
All this is good news from the Fed's perspective, giving the central bank incremental room for monetary expansion. It's unclear where the Fed-induced bubble will show up, but for now it's not in commodities.
Which stock should you buy in your very next trade?
With valuations skyrocketing in 2024, many investors are uneasy putting more money into stocks. Unsure where to invest next? Get access to our proven portfolios and discover high-potential opportunities.
In 2024 alone, ProPicks AI identified 2 stocks that surged over 150%, 4 additional stocks that leaped over 30%, and 3 more that climbed over 25%. That's an impressive track record.
With portfolios tailored for Dow stocks, S&P stocks, Tech stocks, and Mid Cap stocks, you can explore various wealth-building strategies.
