
Good news for bulls, the Russell 2000 is only 4 points away from negating the 'bull trap' and re-establishing the rally from June. Technicals are just a MACD 'buy' trigger away from returning to their net bullish form. Cyclical bull markets are heavily dependent on leadership from more speculative, growth focused stocks as found in the Russell 2000. And given the action of Thursday and Friday it's clear it didn't take much to bring bulls back to the trough.
Looking at the weekly chart for the Russell 2000, the broader rally dating back to the latter part of 2012 is also intact. Stochastics have been overbought throughout this rally, reflecting the very strong bullish momentum still evident in this market. Unlike the daily chart, there was a fresh 'buy' in the MACD weekly timeframe, again pointing to the long term strength in this index.
The Nasdaq is riding the upper channel line. Like the Russell 2000, Nasdaq stochastics are heavily overbought. On-Balance-Volume has also been consistent with accumulation. Although my #sectorbreadth studies are showing weakness in Technology stocks. 
Nasdaq Breadth will see a challenge on bearish divergences in the Percentage of Nasdaq Stocks above 50-day and 200-day MAs. Should these break higher next week it will set up for similar upside moves in the Nasdaq Bullish Percents and Nasdaq Summation Index. Although a failure to do so would suggest Friday's recovery was just a sympathetic move to Small Caps gains, and not a strong move on the part of sideline money to buy Technology stocks.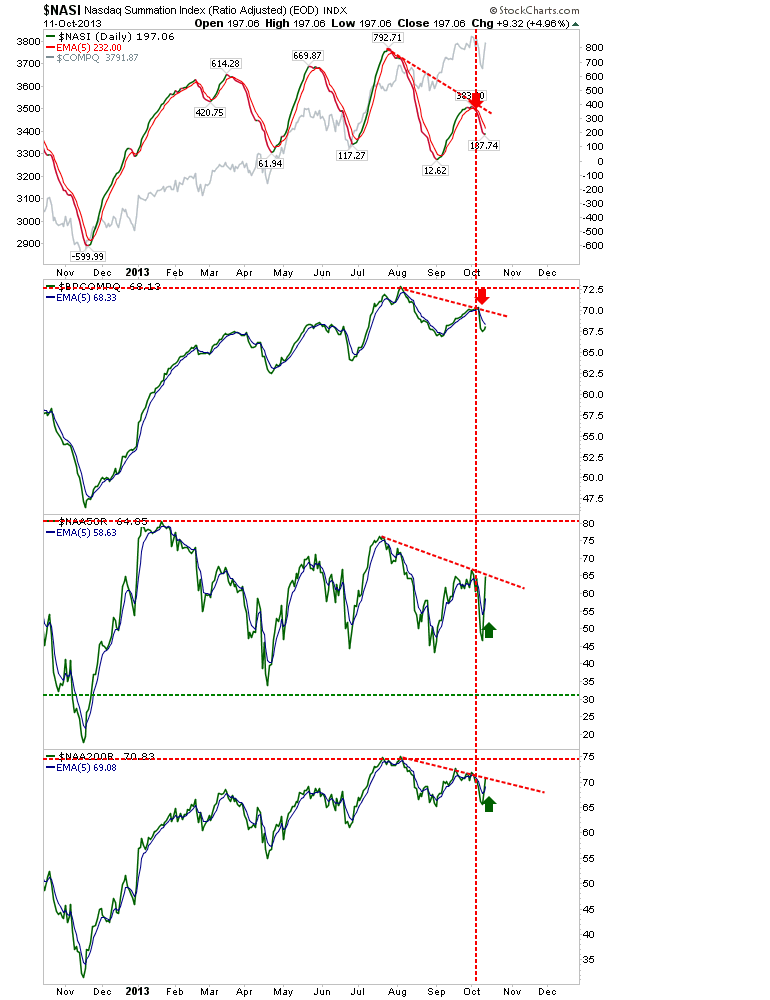
In more mixed news for bulls is the Percentage of New Highs and Lows for the indices. For both the S&P and Nasdaq the percentage of new highs has dropped considerably, something consistent with a mid-phase rally, not something which typically marks a major top. Likewise, the decline didn't bring a spike in new lows - so no major bottom either. 
The S&P has been riding channel support. It too has excellent long term technicals (Stochastics and On-Balance-Volume), although the MACD trigger histogram is negative. But traders looking for a buying opportunity could play for a long trade from channel support to channel resistance. 
Despite this being a rally which is long in the tooth, last week's action suggests bulls have more to offer. Until proven otherwise (i.e. confirmed breaks of the 2012-phase trend), it's hard to justify a position against this flow.
Which stock should you buy in your very next trade?
With valuations skyrocketing in 2024, many investors are uneasy putting more money into stocks. Unsure where to invest next? Get access to our proven portfolios and discover high-potential opportunities.
In 2024 alone, ProPicks AI identified 2 stocks that surged over 150%, 4 additional stocks that leaped over 30%, and 3 more that climbed over 25%. That's an impressive track record.
With portfolios tailored for Dow stocks, S&P stocks, Tech stocks, and Mid Cap stocks, you can explore various wealth-building strategies.