The Week That Was
All four major US indices—the S&P 500, Dow, NASDAQ and Russell 2000—moved higher on Friday, each finishing a third straight week of gains. The bullish finale came despite the looming threat of a US government shutdown.
As we've pointed out before, time and again, since the mid-2016 Brexit vote, equity investors have tended toward optimism, focusing on good news. This time, it was a report that regulators are close to easing banking rules yet further. On the other hand, however, investors have tended to gloss over the bad news, disregarding potential threats and recovering quickly from any actual threats.
Since the Friday close—indeed, as of midnight Friday—the much discussed and even previously avoided government shutdown has come to pass. We will elaborate on the affect the shutdown has had on indices thus far once trading begins during the coming week. However, it appears that markets have generally shrugged off previous shutdowns.
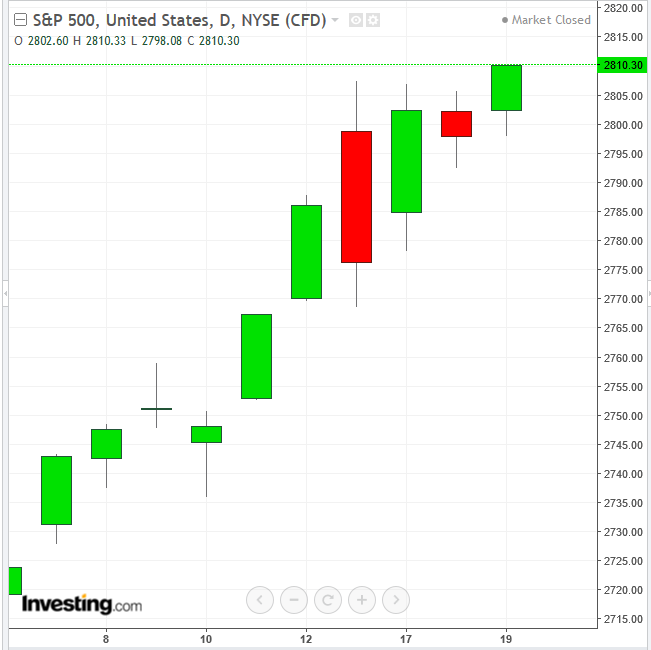
The S&P 500 advanced 0.44 percent Friday, posting both a record high and record close. The up-move was led by Consumer Staples, +1.12 percent. The only two sectors in the red were Utilities, down 0.30 percent and Energy with 0.13 percent loss. On the week the benchmark index gained 0.86 percent, led, once again, by Consumer Staples, which added 2.44 percent; the worst performing sector was Energy, which fell 1.34 percent.
The Dow Jones Industrial Average gained 0.22 percent on Friday, posting no record, and added 1.06 percent for the week. The NASDAQ Composite rallied 0.56 percent on Friday, hitting both an all-time high and record close, gaining 1.04 percent for the week.
The Russell 2000 jumped more than its sister indices on Friday, up 1.3 percent, posting a record close but not an all-time high. On a weekly basis, the small-cap index advanced 0.29 percent.
Technically, all four indices declined on a weekly basis (about 1.35 percent for all, except about 1.85 percent for the Russel), before closing relatively near to their weekly opening prices. This behavior formed a hanging man. Should a weekly confirmation follow, with a close beneath last week’s real body (price between open and close, ignoring the upper and lower shadows) it would provide a bearish signal.
Such a lower close would leave all the long positions “hanging” with a losing position. This pattern, formed at a record high, could potentially make investors nervous, and as the expression indicates, leave them “hanging on for dear life.” This could possibly kickstart an unwinding of long trades, which could cascading into selling pressure. Should the price therefore decline, it would likely rev up the unwind, further pushing prices down, which naturally further speeds any additional unwinding. At some point, speculators notice a potential correction and enter short positions, adding their own weight onto prices.
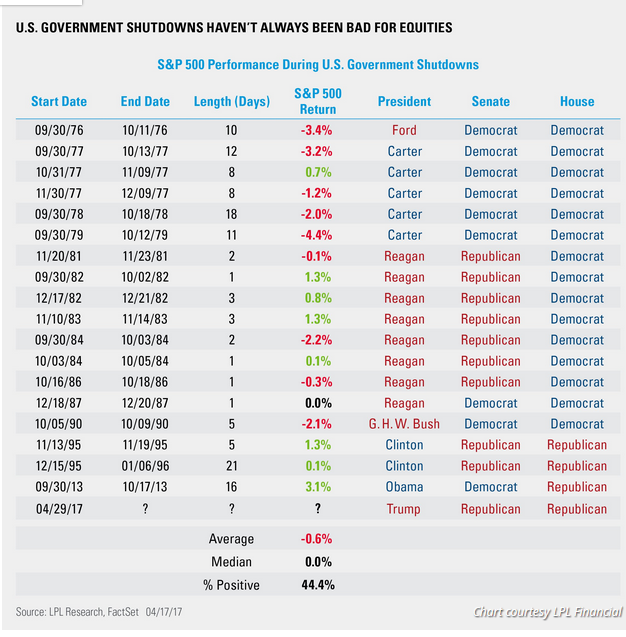
How might the government shutdown affect the market? A government shutdown itself is temporary drama and rarely has any long-lasting impact. The more significant threat is a heightened risk down the road, when it comes to a potential inability of Congress to raise the debt ceiling. Should the political battle of the shutdown grow into something bigger, stocks may likely be sold off, but if the last three shutdowns are any indicator, such selling would be temporary, actually providing buying opportunities.
Still, in the late 70s market declines followed government shutdowns. At the time, equity investors were much more sensitive to political risk, certainly abundantly more so then they have been since the Brexit vote.
Dollar Signals Bear Market Endures
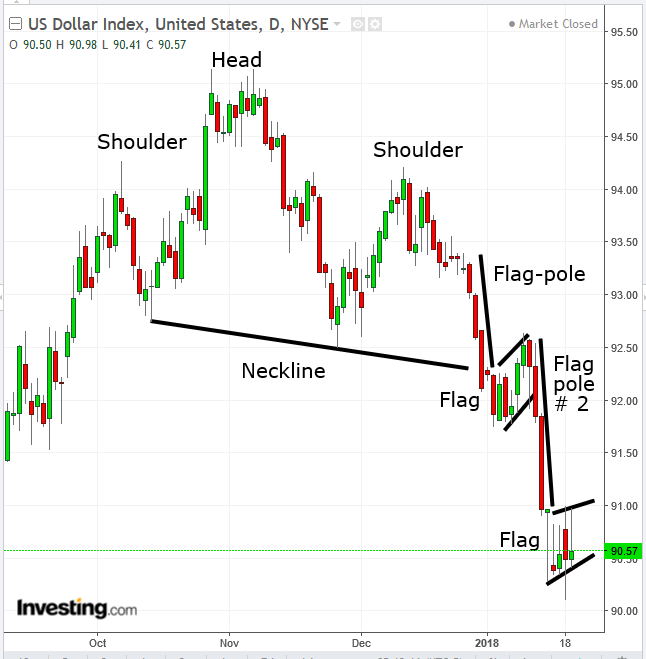
On Thursday, the dollar reached a new low of 90.11, then rebounded to 90.57, slipping for a fifth straight week. The bounce respected the support of an exceptionally bullish hammer (extremely long shadow, demonstrating how ruthlessly the bulls fought back), pushing the price back up from the abyss.
However valiant the bullish strike back, the damage had been done with the hammer extending a fresh low, below the September trough, extending the downtrend since January 2016. The price then moved sideways for the next four days, potentially forming a continuation Rising Flag, like the one seen during the first 10 days of January, which proved itself with another leg in the decline. A downside breakout of the current flag would indicate another leg down.
Euro Hits New Peak
At the same time, the single currency reached its highest price since December 15, 2014. Moreover, the euro registered a new peak, above the September 8, 1.2094 high, solidifying the uptrend.
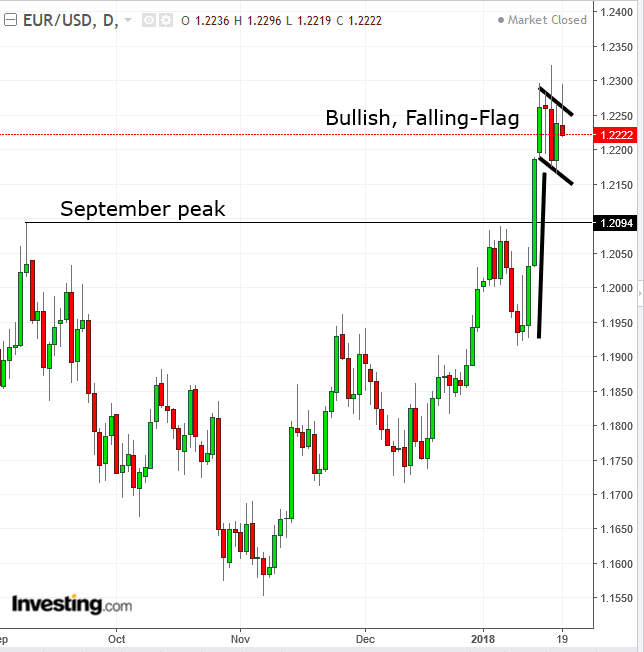
In a mirror image of the dollar’s continuation rising-flag within a downtrend, the euro is developing a continuation falling-flag within an uptrend,
Treasurys Signal Bond Bear Market
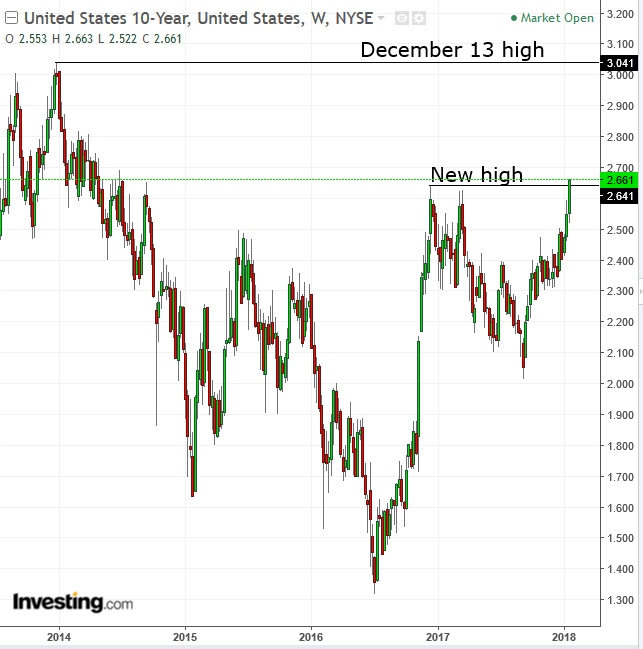
The 10-year Treasury yield closed at 2.661 percent on Friday, only 0.2 basis points below the the highest level of the day, leaving Treasury bears in charge. This is its highest level since June 2013. Moreover, it registered a new peak since the mid-2016 low of 1.321 percent. This completes two rising peaks and troughs for the yield, putting the 10-year Treasury bill in a bear market in the midterm. A peak higher than the December 2013, 3.041 percent level would turn this into a long-term bear market.
Bitcoin
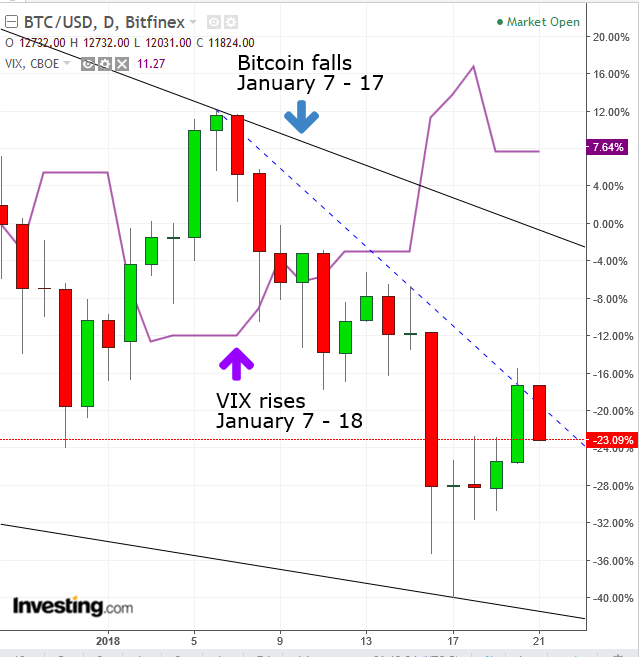
India has followed China's lead in clamping down on Bitcoin, as Indian banks suspend exchange accounts. This morning in Asia, the most popular cryptocurrency dropped 7.37 percent to $11,791, ending a two-day rebound. As of this writing it's up again, just a hair past the $12K mark.
A currently trending report notes that money laundering via Bitcoin isn't particularly significant, less than one percent of transactions, but most governments remain unconvinced. According to Deutsche Bank the correlation between Bitcoin and the VIX is becoming increasingly dramatic, suggesting that investors consider it as another risk asset, something they are more likely to buy when conventional market volatility decreases and sell off when market volatility increases, as it did last week.
The Week Ahead
All times listed are EST
Monday
8:30: US – Chicago Fed National Activity Index (December): expected to rise to 0.44 from 0.15.
22:00: Japan – BoJ Rate Decision: no change in policy expected, but the discussion could be interesting, given the shifting sands in central banking.
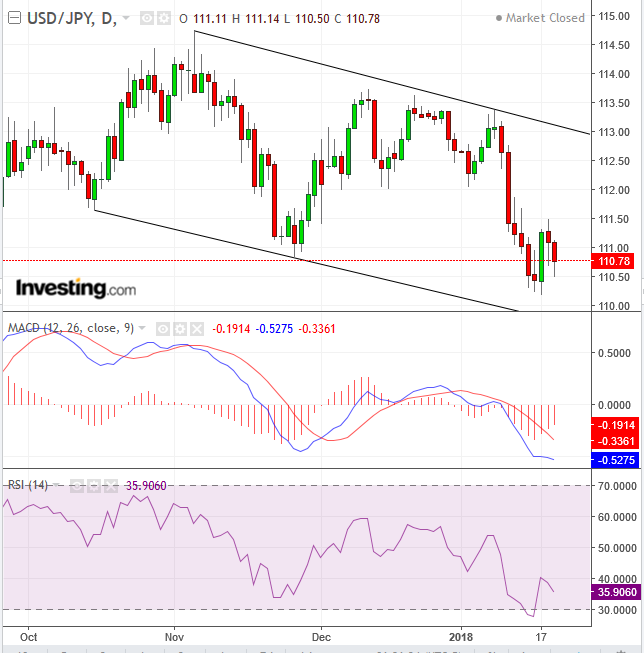
The USD/JPY pair has consolidated at the bottom of the falling channel, along with the oversold RSI and turning MACD, suggest a correction toward the channel top.
Tuesday
5:00: Germany – German ZEW (January): economic sentiment expected to rise to 18 from 17.4.
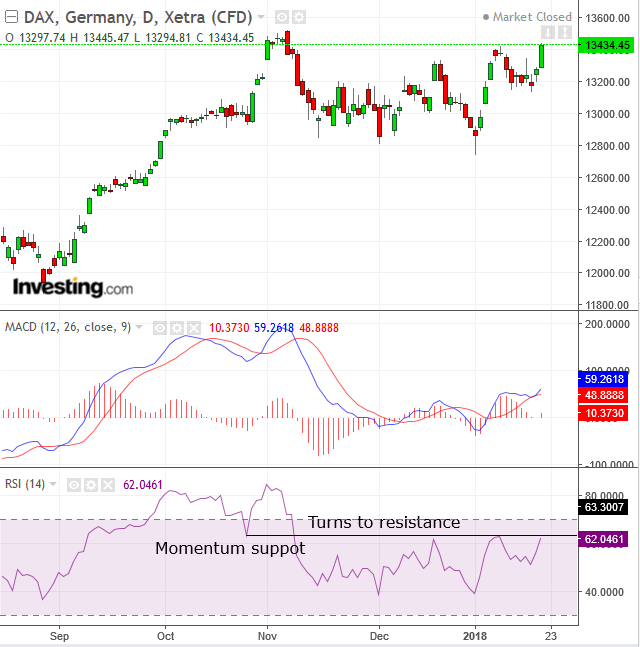
A resistance in Germany's DAX's RSI forewarns of the resistance of the November 7, 13,525.56 all-time high.
10:00: Eurozone – Consumer Confidence (January, flash): forecast to rise to 0.7 from 0.5.
18:50: Japan – Trade Balance (December): surplus expected to rise to Y443 billion from Y113 billion.
Wednesday
4:00-5:00: French, German, Eurozone Services PMI and French, German, Eurozone Manufacturing PMI (January, flash): these will be key for euro and eurozone stock market direction, especially ahead of this week’s European Central Bank (ECB) meeting.
4:30: UK – Employment Data: December claimant count forecast to rise by 3200 from 5900 a month earlier, while the unemployment rate for November falls to 4.2% from 4.3%. In addition, November average earnings expected to rise 2.5%, in line with October.
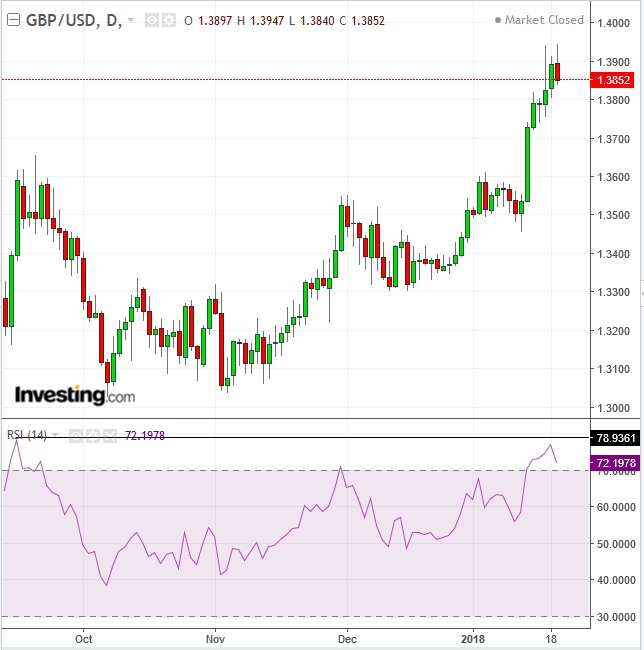
The GBP/USD pair has been struggling to make new highs over the past 3 trading days. The RSI is overbought and has reached its highest since September 15, which preceded a better than a 4-percent correction.
9:45: US – Manufacturing and Services PMI (January, flash): manufacturing reading expected to rise to 55.8 from 55.1, while services falls to 53 from 53.7.
10:00: US – Existing Home Sales (December): forecast to rise by 5.69 million.
10:30: US – EIA Crude Inventories (w/e 19 January): oil stockpiles forecast to fall by 760,000 barrels.
Thursday
4:00: Germany – German IFO (January): business climate index forecast to rise to 117.5 from 117.2.
7:45: Eurozone – ECB decision (1.30pm press conference): while no change in policy is expected, recent comments about the direction of policy this year, plus the minutes of the December meeting, will mean that the press conference will be interesting to watch.
10:00: US – New Home Sales (December): expected to rise by 0.3% after a 17.5% jump in November.
18:30: Japan – Inflation (December): CPI expected to fall to 0.3% YoY from 0.6%.
Friday
4:30: UK – GDP (Q4, preliminary): this first estimate of GDP is forecast to see growth rise to 1.8% from 1.7% YoY, and to 0.5% from 0.4% QoQ.
8:30: US – GDP (Q4, preliminary), Durable Goods Orders (December): GDP growth forecast to be 3% QoQ, from 3.2%. Durable goods orders expected to rise 0.8% MoM from 1.3%, and 0.2% from a 0.1% drop excluding transportation orders.
8:30: Canada – CPI (December): inflation forecast to stay at 2.1% YoY, and fall to 0.2% MoM from 0.3%.
