
I discussed previously that the bounce in the economic data in Q3 may have been a temporary anomaly. That statement was based on the extraordinarily weak start of 2013 due to the combined impact of Hurricane Sandy and the "fiscal cliff." To wit:
"It has been a 'Summer of Recovery' for the U.S. economy with GDP growth rising from 1.1% in the first quarter to 2.5% in the second and manufacturing surveys showed sharp jumps in new orders and outlooks. The same occurred in the Eurozone with Markit's PMI reports showing sharp bounces higher and hopes that the recession that has plagued the region was finally coming to an end. The question of sustainability remains.
I have noted several times as of late, most recently here, that the recent bumps in economic activity, particularly in the survey and sentiment data, is most likely due to short term restocking activity rather than actual economic improvement."
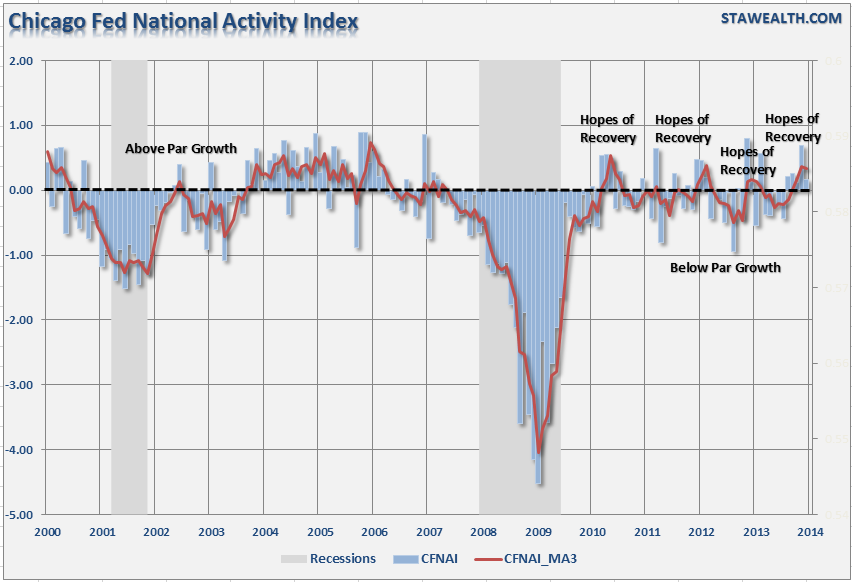
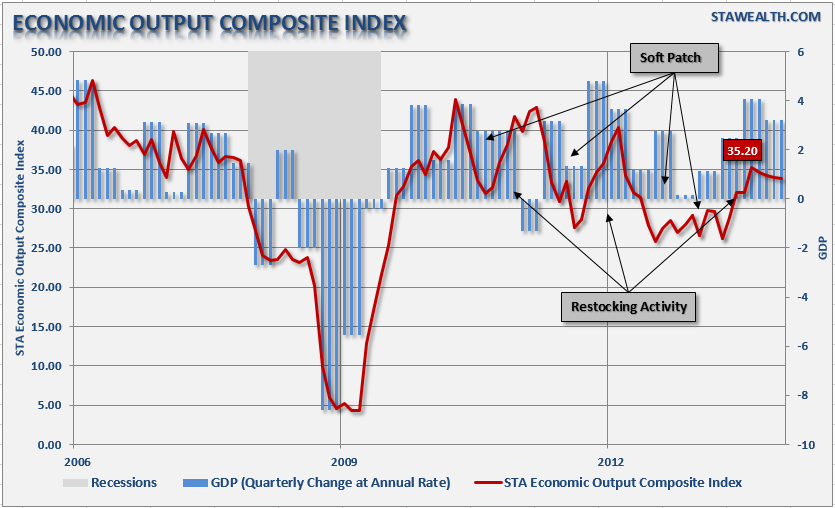
The reason I bring this up is due to the release of "The Most Important Economic Number" I watch. The Chicago Fed National Activity Index, which is a composite index made up of 85 subcomponents that give a broad overview of overall economic activity in the U.S, is often ignored by the mainstream media which could be a mistake. The reason is, unlike the backward-looking statistics of GDP, the CFNAI is a forward looking metric that gives some indication of how the economy is likely to look in the coming months. The December survey showed an overall decline to .16 from .69 in November.
This sharp decline in activity, which will be attributed to the cold snap in December, is more likely due to softer economic data in recent months. The overall index is broken down into four major sub-categories which cover:
- Production & Income
- Employment, Unemployment & Hours
- Personal Consumption & Housing
- Sales, Orders & Inventories
To get a better grasp of these four major sub-components I have constructed a 4-panel chart showing each of the individual subcomponents as compared to a major economic indicator. As you can see, there are historically some very close comparisons between the major economic indicators and the underlying sub-index of the CFNAI.
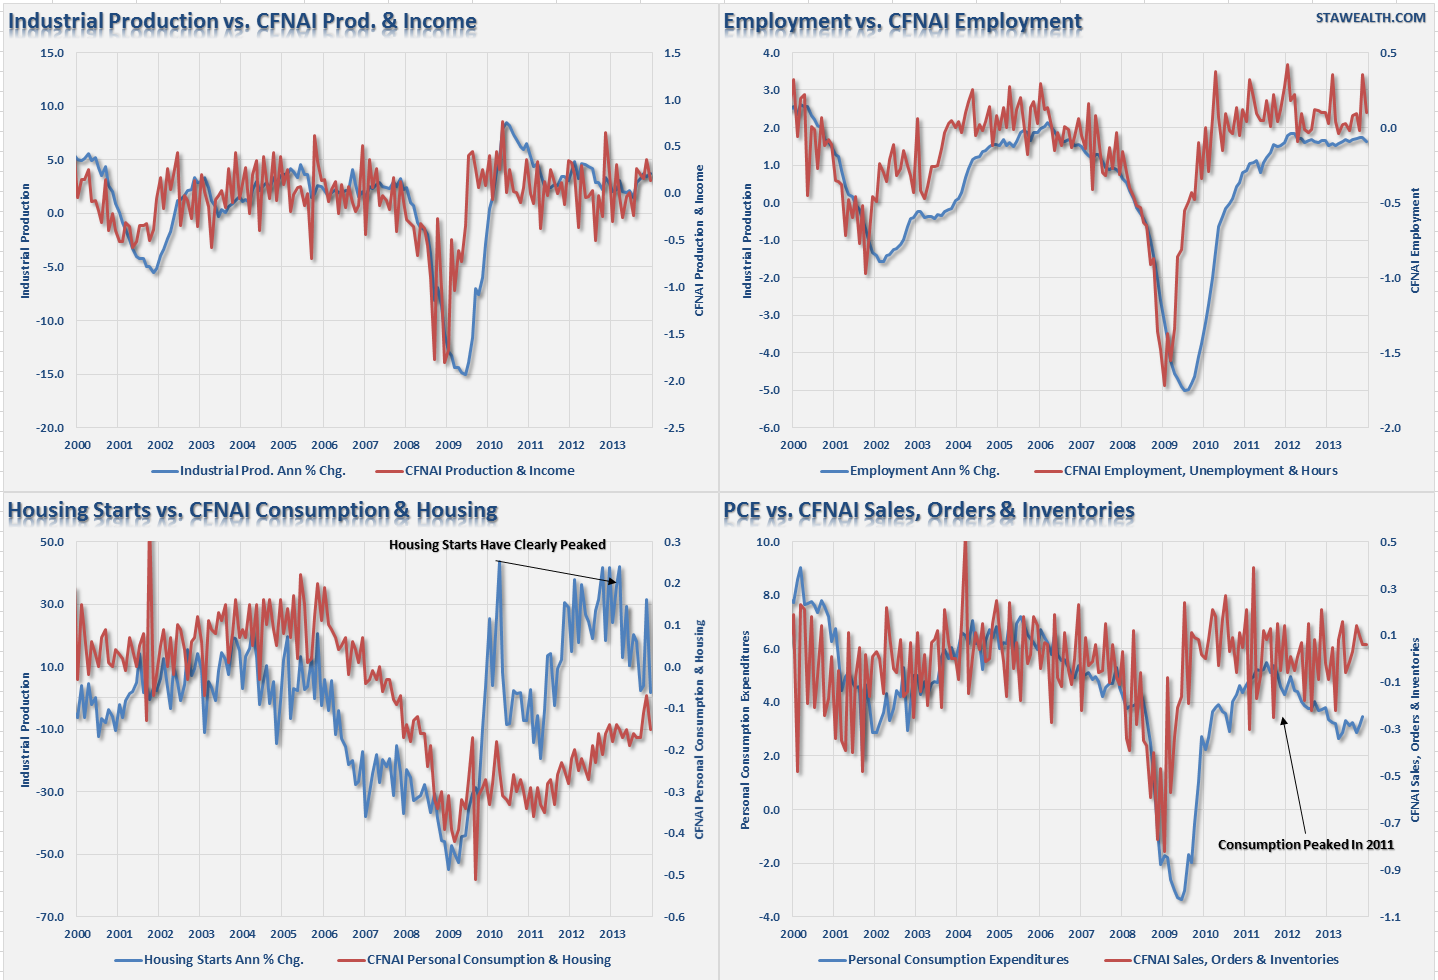
While all four subcomponents clearly show a sharp post-recession rebound; it appears that each have also reached the mature stage of the current economic cycle. However, the lower-left quadrant showing housing starts as compared to personal consumption and housing really stood out. One of the primary arguments for the continuation of the "economic recovery" story has been the support derived from residential housing. However, within that housing component, the most critical is housing starts. Existing home sales and permits have little economic impact with respect to the amount of activity generated by the construction of a new home. It is the cycle from architects, to engineering, to construction and completion involved in building of a new home which has the greatest economic multiplier. The problem, as shown in the chart above it appears that housing starts may have peaked for the current economic cycle.
Furthermore, in regards to economic impact, Personal Consumption Expenditures (PCE) is by far the most important as it comprises roughly 70% of the GDP calculation. It is clear that PCE peaked in 2011 and has been reflected in continued sub-par economic growth. This has been the story of the last few years, which has continued to confound and baffle the Federal Reserve, as to why successive rounds of monetary interventions has done little to spur real economic growth. However, the CFNAI has been clearly showing a "struggle through" economy, as shown in the chart below, which compares the CFNAI with its 3-month moving average. This also provides some explanation why employment remains constrained.
Supply/Demand Imbalance
To really understand this conundrum a bit better let's look at the CFNAI a little differently. If we break up the sub-components into two different categories, "supply" and "demand", we can get a better look at what is likely to drive future decisions by business owners. As a business owner myself; I can tell you that businesses will only increase production and employment when they feel confident about future customer demand.
In this regard, we can look at the CFNAI as customer "demand" and business "supply." The subcomponents of "Consumption & Housing" and "Sales, Orders and Inventories" most adequately reflect customer demand while business supply is represented by "Production & Income" and "Employment, Unemployment and Hours." The chart below shows the 3-month average of the "business supply" and "customer demand" indexes. While demand has picked up modestly in the last couple of months, it is likely to be somewhat ephemeral due the recent weaknesses in consumer related data.
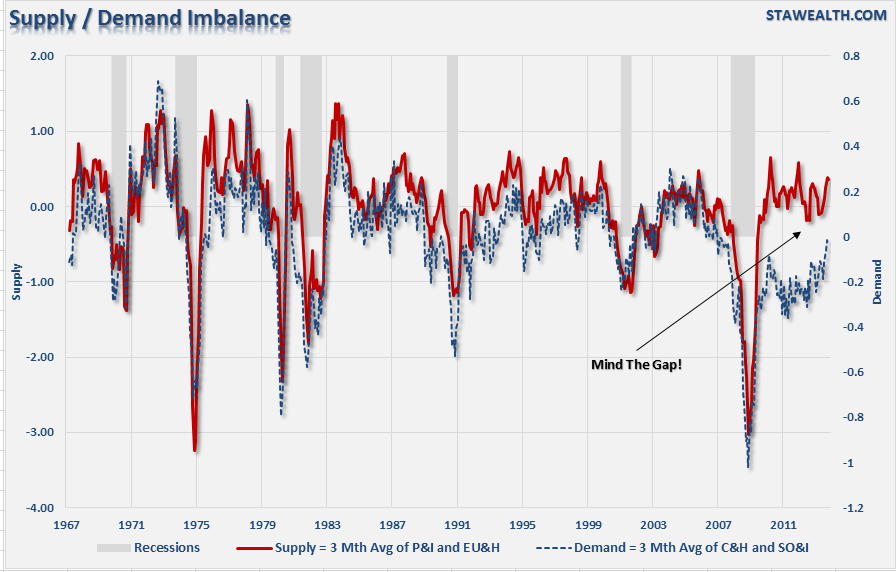
It is important to notice that historically the demand side of the CFNAI has always led the supply side. This is exactly as it should be as demand drives production. However, unlike every previous cycle, the demand structure is not only lagging the supply since the end of the last recession - it is still at levels that are normally consistent WITH recessionary lows.
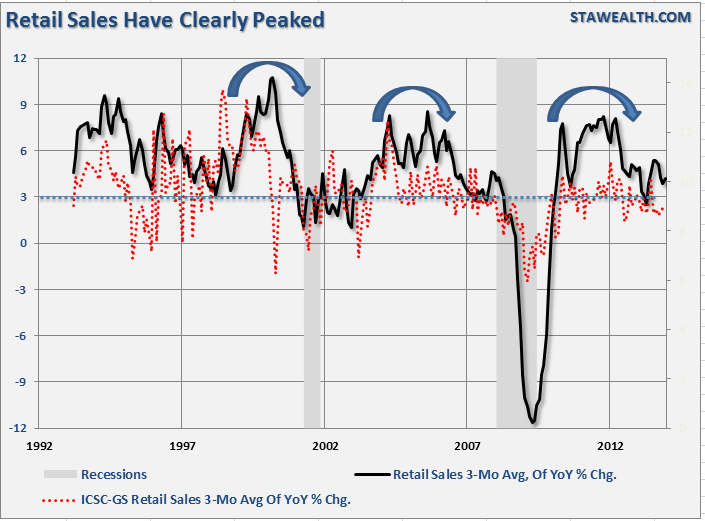
This data corresponds with the NFIB survey which shows "poor sales" still ranks among the top 3 concerns of small businesses. If consumption, sales and orders remain weak; businesses will not be able to sustain higher levels of production and employment for very long. Either, the recent uptick in consumer demand is sustainable and will catch up with current production or production will slow down. The recent retail sales data, as shown below, suggests that the recent surge in demand may be slowing.
Which stock should you buy in your very next trade?
With valuations skyrocketing in 2024, many investors are uneasy putting more money into stocks. Unsure where to invest next? Get access to our proven portfolios and discover high-potential opportunities.
In 2024 alone, ProPicks AI identified 2 stocks that surged over 150%, 4 additional stocks that leaped over 30%, and 3 more that climbed over 25%. That's an impressive track record.
With portfolios tailored for Dow stocks, S&P stocks, Tech stocks, and Mid Cap stocks, you can explore various wealth-building strategies.