Get 40% Off
⚠ Earnings Alert! Which stocks are poised to surge?
See the stocks on our ProPicks radar. These strategies gained 19.7% year-to-date.
Unlock full list

Was $780 All Tesla’s Dead-Cat Bounce Wrote?

Published 04/19/2021, 03:37 PM
Updated 07/09/2023, 06:31 AM

A month ago, I was looking for a bounce in Tesla (NASDAQ:TSLA) stock to ideally $825+/-25, fined tuned to $815.

Last week, on April 14, TSLA topped at $780. Was that all she wrote? Was my forecast off by 2.5 to 4.3%? It sure could be so because my margin of error is +/-5%, as no method, not even the Elliott Wave Principle (EWP), can ever be always 100% accurate and exact.

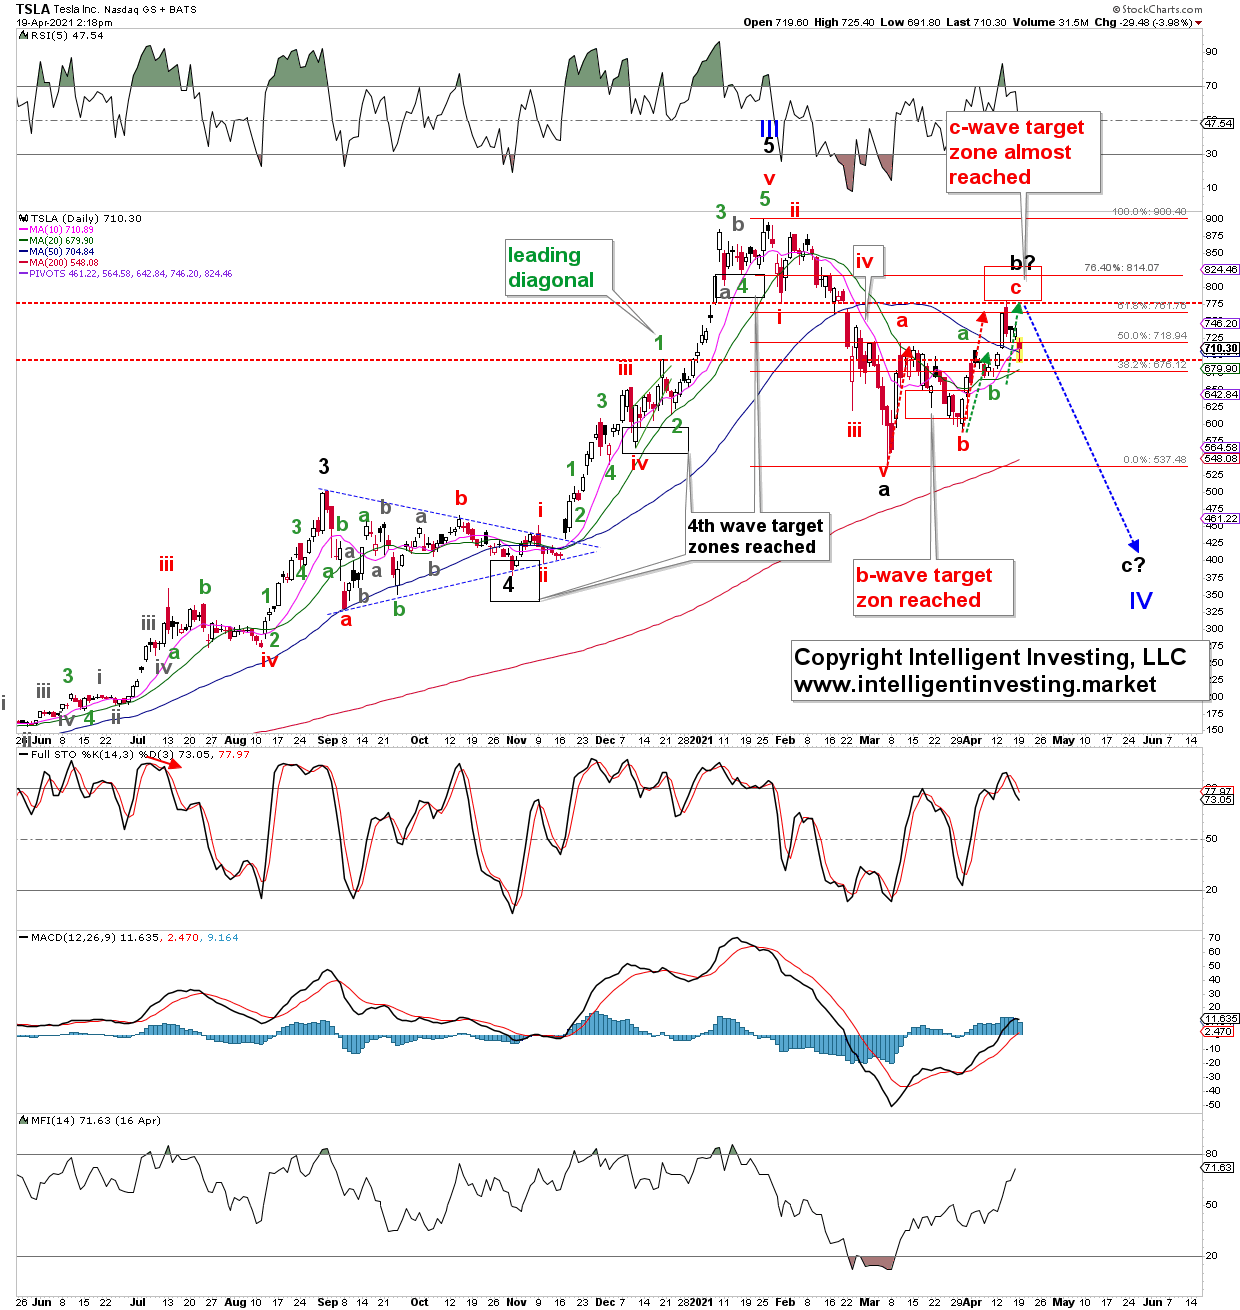
What matters is that using the EWP, I forecasted rather accurately where many prior 4th waves and the recent (red) b-wave would bottom. See the “callouts” in Figure 1 in red and black below. That is why we know the method is reliable, and we should expect it to continue to deliver accordingly.

Figure 1: TSLA daily candlestick chart with EWP Count and Technical Indicators:
Tesla Daily Chart.

The critical question is, as usual in the financial markets, what is next?

Currently, TSLA is right at important Simple Moving Averages (SMA) support, as it is still holding the 10-day, 20-day and 50-day SMA ($711, $680, $705; respectively). If it can keep these SMAs as support, it still has a shot at moving closer, i.e., inside the ideal (red) c-wave target zone because it just fell a little shy of it last week. Besides, the rally since the $539 low made on March 5, labelled as major (black) wave-a, still counts best as only three waves up, after five waves decline. Thus, it is still to be considered a counter-trend rally. The red and green dotted arrows show TSLA reached ideal c=a extensions last week at two different wave degrees: red intermediate and green minor. Thus, technically the “dead-cat” bounce can be complete.

A daily close below the recent (green) minor-b wave low at $668 made on April 8 will be the first severe warning for TLSA bulls that the stock is on its way down to the ideal $450+/-25 zone. Full confirmation of this path lower will be achieved on a daily close below the (red) intermediate-a wave low at $591 made on March 30. Conversely, TSLA bulls need to rally the price back above last week’s high to target the $825+/-25 zone.

Bottom Line: The anticipated, detailed EWP count shared over the last several updates has unfolded well. Last week, TSLA fell marginally short of the ideal dead-cat bounce upside target. Still, if it was indeed only a counter-trend rally, it should not be too surprising because “in bear markets upside disappoints and downside surprises.” If TSLA remains below $780, I now prefer to look lower to ideally $450+/-25. From there, I expect a sizeable multi-month rally to new all-time highs.

Latest comments

Tesla is on it path to 1000
Tesla to touch 850 before earnings..
This stock trades on headlines and Elon Musk Tweets, not technicals.
Tesla first took out the low of 624 before rallying. I believe you said it had to hold that low.
Hi, thanks but please note that 4 weeks ago I found "Thus, as long as $600 holds, which is the lower end of the red wave-b target zone, and ideally today’s low hold, I expect the next move higher towards $800-825 to get going soon, targeting $815 ideally. Once this red intermediate wave-c of black major-b completes, I expect the next leg lower: wave-c of blue Primary-IV to ideally $450+/-25."  So far so good as $600 held on a closing basis. Intra-day it went to as low as $591... pardon my $9 (1.5%) inaccuracy...  Besides, 6 weeks ago I wrote "The three waves up are currently in progress, and the first wave has likely completed (red wave-a). The second wave is now underway (red wave-b) to ideally $625+/-25, from where the next move higher (red wave-c) should kick into ideally $825+/-25 for a typical wave-C=wave-A relationship"  Again, pardon my inaccuracy as we got $591 and not $600... I honestly don't think there's a method that can forecast this precisely.
Risk Disclosure: Trading in financial instruments and/or cryptocurrencies involves high risks including the risk of losing some, or all, of your investment amount, and may not be suitable for all investors. Prices of cryptocurrencies are extremely volatile and may be affected by external factors such as financial, regulatory or political events. Trading on margin increases the financial risks.
Before deciding to trade in financial instrument or cryptocurrencies you should be fully informed of the risks and costs associated with trading the financial markets, carefully consider your investment objectives, level of experience, and risk appetite, and seek professional advice where needed.
Fusion Media would like to remind you that the data contained in this website is not necessarily real-time nor accurate. The data and prices on the website are not necessarily provided by any market or exchange, but may be provided by market makers, and so prices may not be accurate and may differ from the actual price at any given market, meaning prices are indicative and not appropriate for trading purposes. Fusion Media and any provider of the data contained in this website will not accept liability for any loss or damage as a result of your trading, or your reliance on the information contained within this website.
It is prohibited to use, store, reproduce, display, modify, transmit or distribute the data contained in this website without the explicit prior written permission of Fusion Media and/or the data provider. All intellectual property rights are reserved by the providers and/or the exchange providing the data contained in this website.
Fusion Media may be compensated by the advertisers that appear on the website, based on your interaction with the advertisements or advertisers.
© 2007-2024 - Fusion Media Limited. All Rights Reserved.