If you’re like most folks, you likely at least take a second look when you run into a big dividend yield, like, say, 14%.
Think about that for a second: drop, say, $100K into a fund like that and just seven years later, you’d have collected enough in dividends to recoup your entire initial stake.
Everything else is gravy!
But when we come across a dividend that big, we need to do a second-level analysis to make sure it’s sustainable. And that brings me to the closed-end fund (CEF) I want to tell you about today—it gives us that 14% yield but misses the mark on just about every factor you could imagine, giving us:
The fund I’m talking about: the Eagle Point Credit Company (NYSE:ECC). It’s a smaller CEF (with a $442-million market cap) that deals in collateralized loan obligations (CLOs).
And that’s our first red flag, because CLOs are complex assets not unlike the ones at the center of the 2008–09 financial crisis. Yet CLOs still get a lot of attention because they pay high yields.
The disadvantage? They’re complex, which makes them tough for investors to place a value on—leading to some out-of-whack valuations, as we’ll get into shortly.
So let’s dive into why ECC is a fund you need to avoid now, starting with its fees—9.7% of assets!
A Laundry List of Costs
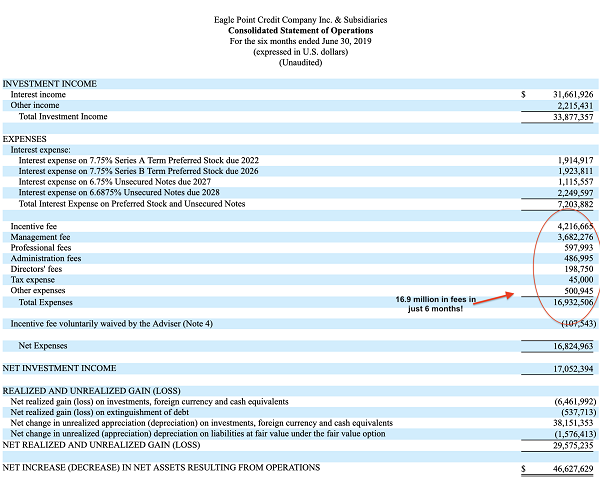
The facts are in ECC’s filings with the Securities and Exchange Commission for the six months ended June 30, 2019, which you can see above.
In half a year, ECC charged investors $16.9 million for administrative, management, and professional fees. That accounts for half of the fund’s investment income over the same period. With just $346.8 million in net assets, those fees, on an annualized basis, make ECC more expensive from a management perspective than any other CEF, ETF or mutual fund.
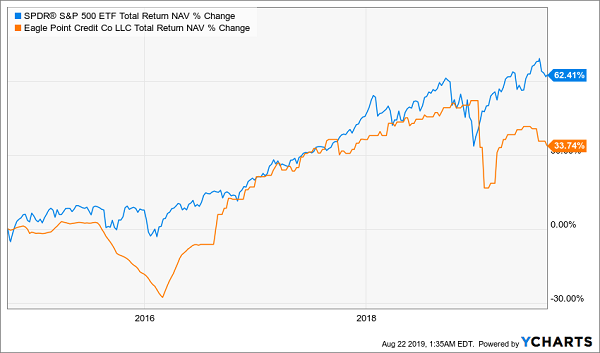
What are ECC’s investors getting for those fees? A fund whose net asset value (that is, the value of its underlying portfolio) has had some runs where it meets the index’s returns but then crashes—which it has done both in late 2015 and more recently:
S&P 500 Outruns ECC
So why do investors keep buying ECC?
One reason is that this kind of data isn’t readily available—NAV returns aren’t easy to find online, so most people don’t know that ECC’s portfolio is trailing the market. Instead, they’re more likely to focus on total price returns (or the fund’s market price, plus dividend payouts), which look a lot better:
Price Returns Look Great …
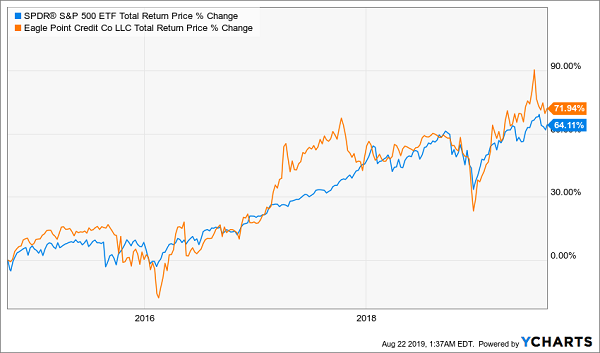
As you can see, on a total-price basis (including dividends), ECC is slightly beating the market. But that’s just because investors have bid the fund’s market price well beyond its NAV:
…But They’re Driven By Overbidding
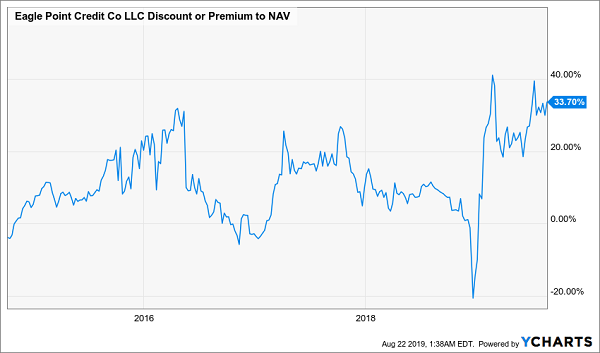
Those price returns look good just because investors—mesmerized by ECC’s sky-high yield—are willing to pay 34% more than the fund’s portfolio is actually worth! That premium is now near record levels, by the way, and the last time ECC’s premium hit a record, investors who bought in got burned:
ECC Investors Buy High—and Are Still Underwater
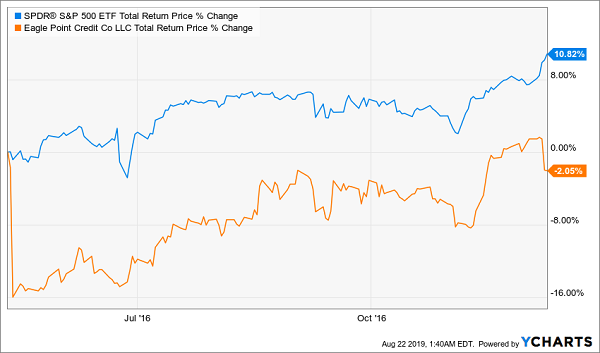
Investors were stuck with a negative total return for the next six months while the stock market was up double digits: hardly the kind of outperformance you’d want from a company charging you 9.7% in fees!
Which brings me back to the dividend.
While that 14% yield is intoxicating, it’s a mirage. ECC bulls take comfort in the fact that the company has never cut dividends, but this is actually a reason to worry.
Let me explain.
When a company or fund has an irregular dividend (or one that’s not paid out on a regular schedule) and occasionally cuts that payout, the market tends to shrug off those cuts as no big deal.
But when dividends have had a regular schedule (ECC pays monthly) and there’s a sudden cut, the market panics. This is what happened with the PIMCO Global StocksPlus Fund (NYSE:PGP), which paid out consistent dividends for a decade before its cut in 2016:
Dividend Cuts Slash the Premium—and Profits
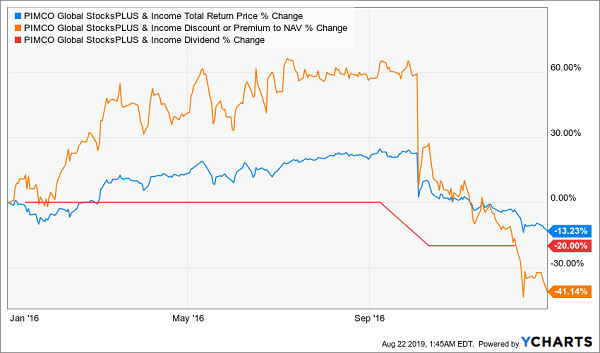
When PGP cut its dividend by 20% (in red above), the fund’s huge premium (in orange) plummeted 60%, resulting in what looked like a steady stream of big profits (in blue) suddenly disappearing. And the longer you stuck around, the worse things got.
Dividend Cuts: Where Persistence Doesn’t Pay Off
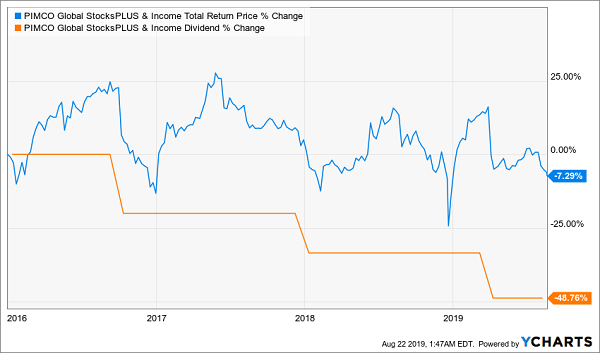
PGP’s dividend is half of what it was a scant three years ago, and losses have racked up even as the S&P 500 is up 63.5% since then.
This future awaits ECC investors.
How do I know? In the fund’s filing with the SEC, which we looked at earlier, we can see that ECC earned $46.6 million on its portfolio in the first half of 2019, or 13.4% on its $346.8 million of net assets. If ECC could do this every six months, it would be just enough to pay off the 21.4% dividend yield (based on NAV) it’s currently paying out.
But that 13.4% return is thanks to a comeback in early 2019. In 2018, ECC lost $54.8 million, meaning the big returns we’ve seen in 2019 are just a snapback from losses last year, from which the fund still hasn’t recovered.
And looking at returns in the second quarter of 2018, it seems clear that ECC’s ability to just barely cover dividends was a one-off: that period saw net profits of just $1.6 million, or an annualized 1.8% return on NAV.
So where does that leave us? With high fees, underperformance and the danger of a dividend cut. This 14% yield is definitely one to be avoided.
Forget ECC: Buy These 8% Dividends With 20%+ Price Upside
I don’t know why you’d be tempted by ECC when there are far better CEFs out there, like the 5 I want to show you right now.
These 5 stout income plays pay 8%, on average, and those dividends are sustainable and growing—so if you hold this portfolio for just a few years, you’ll get to ECC’s 14% payout on your original buy, but you’ll do it the safe and sure way.
And if you don’t care how you bag your returns—through income or capital gains—you won’t have to wait that long, because unlike ECC, which trades at that 34% premium we talked about earlier, these 5 rock-solid income plays trade at totally bizarre discounts that simply can’t last.
The bottom line? I’m calling for 20%+ price returns, on average, from these 5 hidden gems in the next 12 months, to go with your 8% dividend. And unlike ECC, these funds won’t keep you up at night while you get there.
An Assist From the Fed
What’s more, the recent shift in policy from the Federal Reserve—with more interest-rate cuts likely this year—gives this quintet even more upside (and dividend growth) potential, as it cuts their holdings’ borrowing costs and propels their profits higher!
Disclosure: Brett Owens and Michael Foster are contrarian income investors who look for undervalued stocks/funds across the U.S. markets. Click here to learn how to profit from their strategies in the latest report, "7 Great Dividend Growth Stocks for a Secure Retirement."
Which stock should you buy in your very next trade?
With valuations skyrocketing in 2024, many investors are uneasy putting more money into stocks. Unsure where to invest next? Get access to our proven portfolios and discover high-potential opportunities.
In 2024 alone, ProPicks AI identified 2 stocks that surged over 150%, 4 additional stocks that leaped over 30%, and 3 more that climbed over 25%. That's an impressive track record.
With portfolios tailored for Dow stocks, S&P stocks, Tech stocks, and Mid Cap stocks, you can explore various wealth-building strategies.
