Chinese chip stocks jump as Beijing reportedly warns against Nvidia’s H20
A week ago I saw the visually stunning Alfonso Cuarón film - Gravity (in 3D). I'm not really one for Science Fiction, but it was 90 minutes well spent (and my first 3D movie experience). One of the things that struck me about space is how dramatically the temperature changes, which is somewhat intuitive, but I haven't been in a pure Science class in a long time. Specifically, there are swings between +248 degrees and -148 degrees Fahrenheit.
That made me think about equity/commodity market volatility, which can swing dramatically (evidence = last week), but generally speaking has been very muted for the past year.
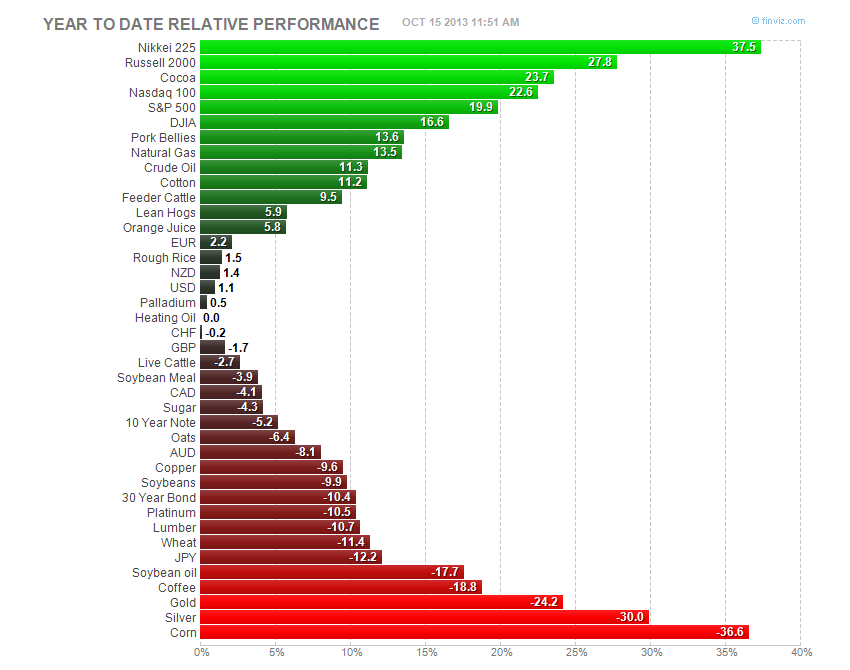
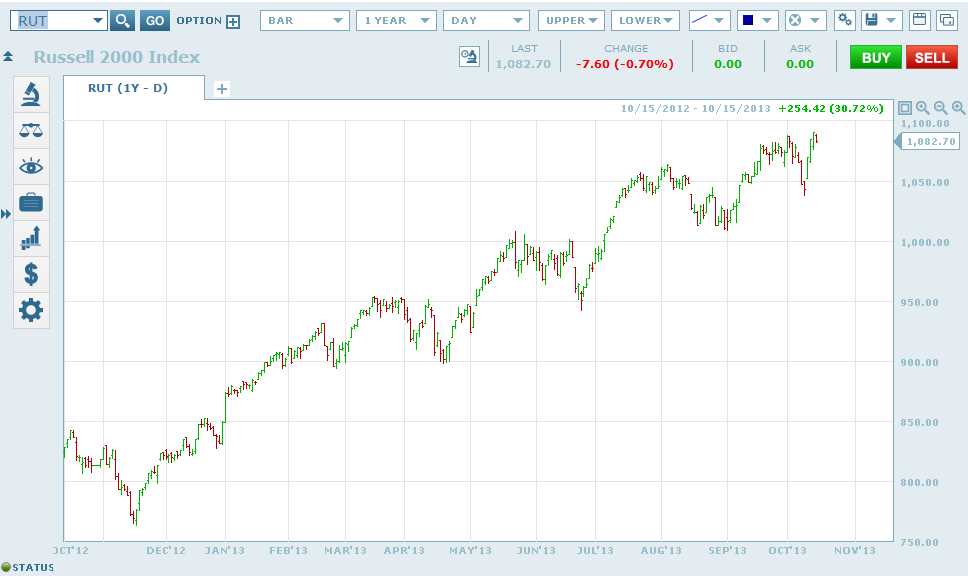
Year to Date - US Equities have performed extraordinarily well:
The RUT is leading the charge (lagging only the Nikkei) up nearly 28% since 1/1/2013. The Nasdaq 100 is higher by 23%. The S&Ps are up 20% and the DJIA is up almost 17%.
Trading, like film making, or just about any endeavor, is part art and part science. You need to understand the market, the mechanics, etc. - that's the "science". The "art" part is much less cut and dried. How do you ply your craft?
Well, in my experience with options (I started on the Chicago Board Options Exchange in the late 90s) - I find ratio spreads to be a tactical way to express a (directional) market sentiment without exposing yourself to a great deal of premium risk in the event that the market does not move in the direction you expect.
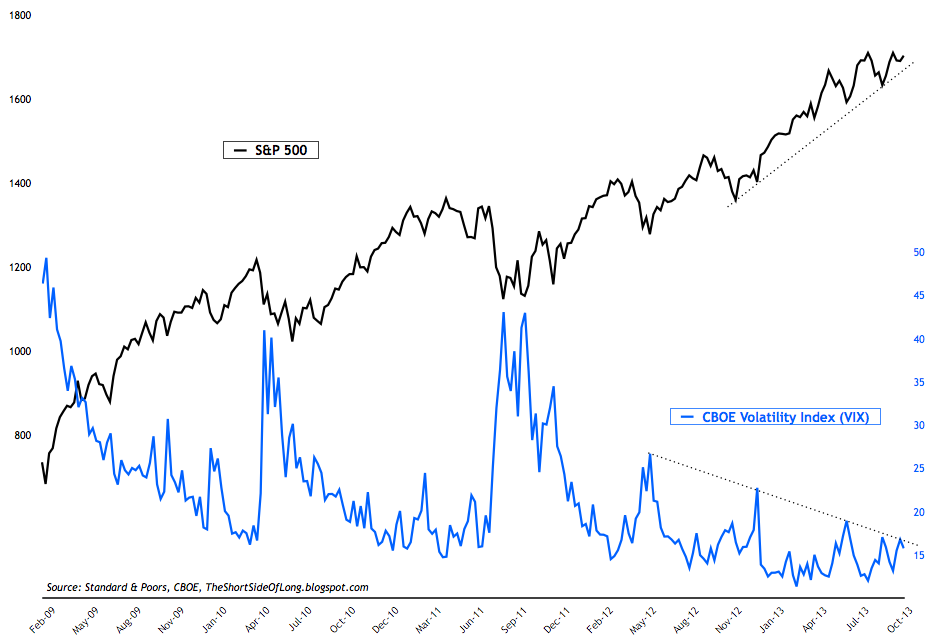
Long story short -- at some point, I expect the "temperature" (market sentiment) to swing and I believe Equities could be susceptible to a ~10% break. As you can see in the chart below, volatility has been grinding lower for two years (since the acute euro-zone crisis/US Debt downgrade).
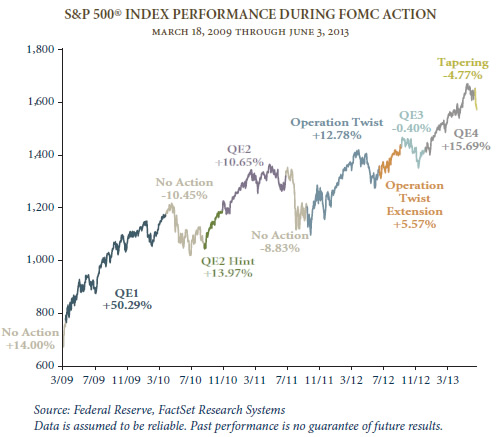
Technically, most equity markets look strong, but there are some cracks in the veneer. Fundamentally, earnings expectations continue to compress and there's only so much buybacks and productivity gains can provide. Much of the blood has been squeezed from that stone. The overarching issue is IF/WHEN WILL THE FED BEGIN THE TAPER PROCESS? Here's your periodic reminder that the Fed has been buying Bonds and MBS EVERY MONTH since AUGUST of 2011....and in the 60 months since Fall of 2008 - there has been bond market support in all but nine months (which ironically was when US stocks got clobbered - mid 2010 and mid/late 2011).
We have NO IDEA if or when US/Global Equity markets will be reintroduced to "Gravity". I'm of the opinion that it will not end well.
With some clients we're positioning for end of year weakness with no upside risk, but if Equity markets broke very hard and very fast, this idea would have plenty of risk.
My preference is to express the market sentiment in the Russell 2000 futures options because it's been the leader. Furthermore, there is slightly more volatility premium in TF (RUT) options than the S&Ps.
Consider the following trade:
- BUY ONE TFZ13 1050 put (Expiration 12/20 or 66 calendar days) pay ~$23.00
- SELL TWO TFZ13 1000 puts (same expiration) collect $12.25 per or $$24.50 total
Long the Russell 2k Dec 1050/1000 1X2 ratio put spread for a $1.50 CREDIT = $150 LESS FRICTIONAL COSTS.
There is NO UPSIDE RISK TO THIS POSITION. The Russell can continue to move higher and because you put this on for a credit that exceeds commission, you have NO risk to the upside.
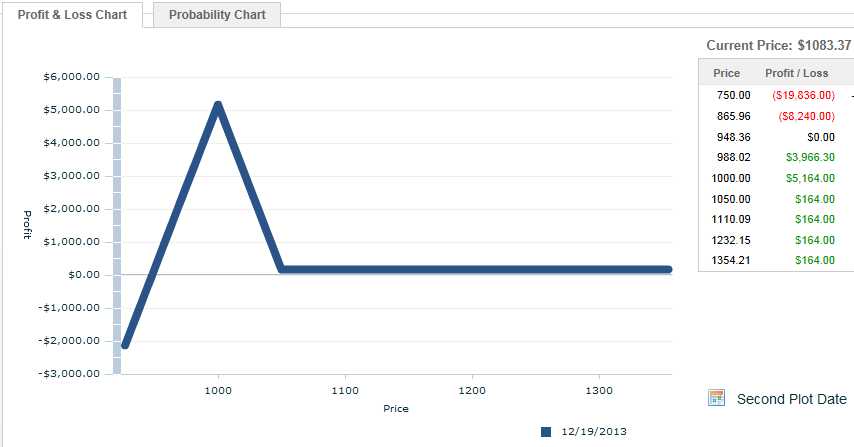
There is DOWNSIDE risk to this position because you are NET SHORT ONE UNIT. There are a couple of ways to stem your risk. At expiration, your downside break even = 950, below which you lose $ dollar for dollar with the future. Example, if you do nothing and futures expire at 925, you're DOWN $2,500/position. At 900, you're DOWN $5k/position.
The sweet spot for this trade is expiration trade of 1000. Best case scenarios almost never come to pass. However, if you held the ratio and we expired @ 1000 on Dec 20th - the position is UP $5k/ratio. That's NOT GOING TO HAPPEN.
In the interim, your risk would be a volatility spike on a quick move lower because the TWO options you're short are likely moving with a greater velocity than the ONE option you're long.
At inception, the position has 5 long deltas, but you're short vega. At any point along the way, you could BUY the Dec 950 put and turn it into a DEFINED risk position (butterfly). At that point your risk would depend on what you paid for that option. Right now it's trading around $700.
P&L Visually:
In the interim, enjoy the all-time highs in the Russell. The proposed trade makes money between 1050 and 950 at expiration. I doubt that we fall below 950 which is a confluence point between old highs and the late June (Taper threat) lows....but it's certainly possible. That would be a 12% move lower in 2 months.
RUT Trade Idea:
Bernanke's last meeting as Chairman of the Federal Reserve is December 18th.
The options in the ratio outlined expire two days later.
If at some point the ratio was worth $2,500 or half of max potential, I would recommend exiting the position. If the RUT futures broke 1000 before November options expiration, you should consider buying the 950 put to fly the risk off.
Kevin Davitt
Which stock should you buy in your very next trade?
AI computing powers are changing the stock market. Investing.com's ProPicks AI includes 6 winning stock portfolios chosen by our advanced AI. In 2024 alone, ProPicks AI identified 2 stocks that surged over 150%, 4 additional stocks that leaped over 30%, and 3 more that climbed over 25%. Which stock will be the next to soar?
Unlock ProPicks AI