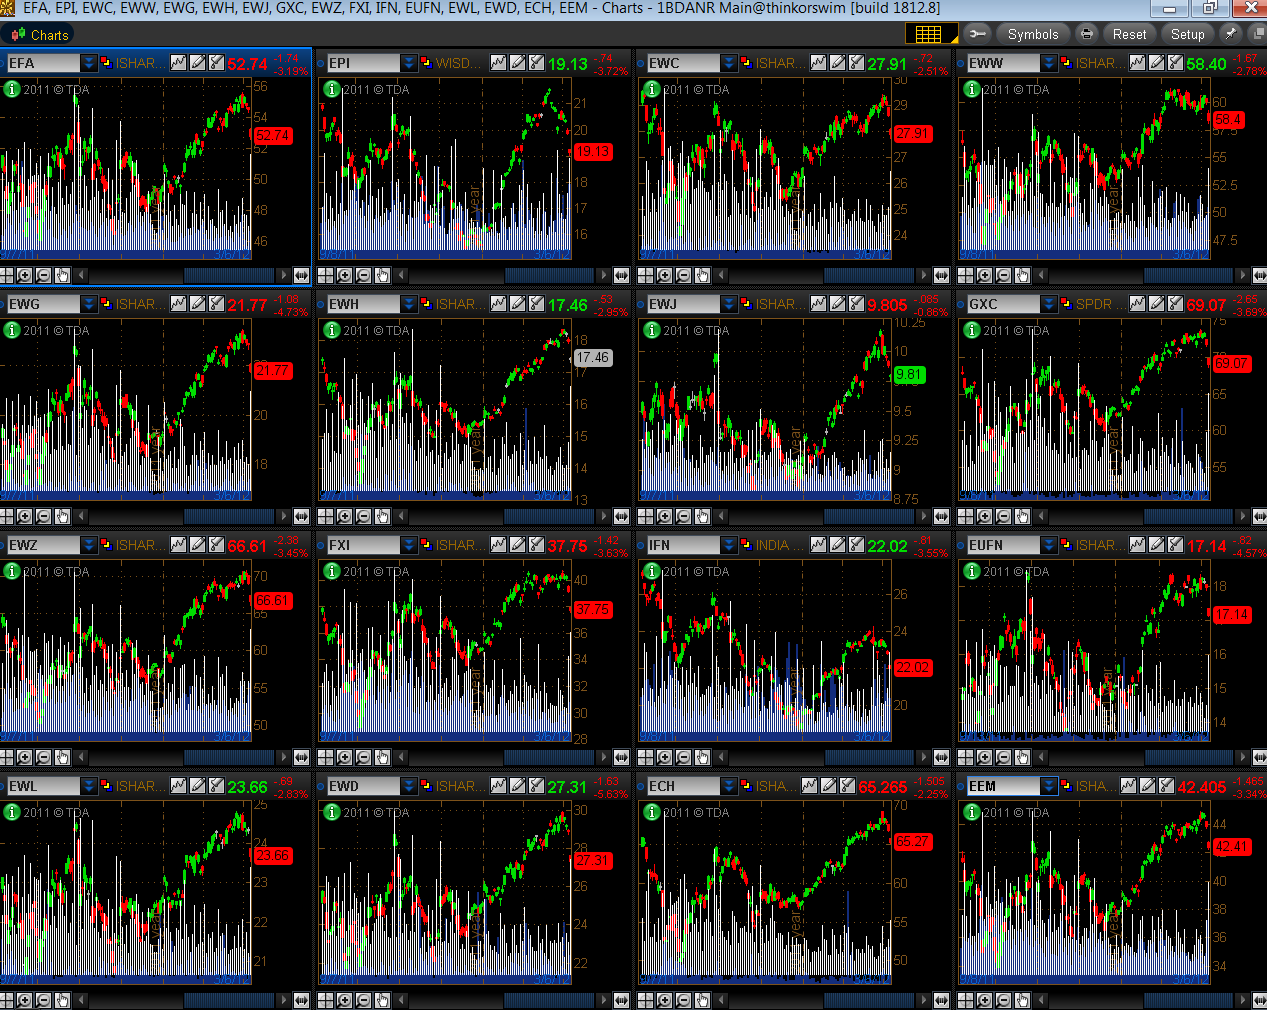
Yesterday's gap-down "shock drop" in foreign ETFs was accompanied by a big volatility spike in each one at levels seen in September/October 2011 during large declines in these markets, as shown on the Daily chartgrid below. Volatility is represented by the white histogram which is overlaid on price.

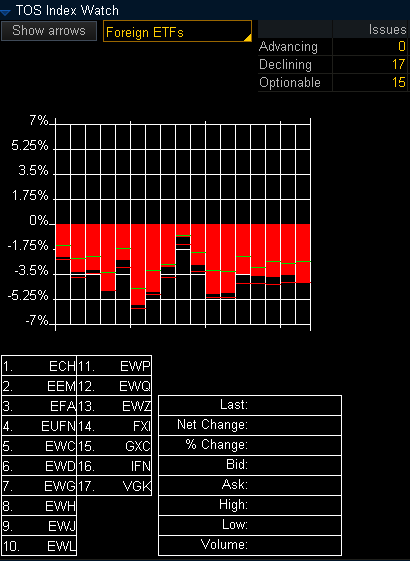
Percentages lost on yesterday's trading in these markets is depicted on the graph below and is reflective of the losses made in Global market indices, as mentioned in my prior post.

Inasmuch as the recent daily uptrend has also been broken on increased volumes on most of these Foreign ETFs, they are worth a close watch for the remainder of the week and in the weeks ahead.

Percentages lost on yesterday's trading in these markets is depicted on the graph below and is reflective of the losses made in Global market indices, as mentioned in my prior post.

Inasmuch as the recent daily uptrend has also been broken on increased volumes on most of these Foreign ETFs, they are worth a close watch for the remainder of the week and in the weeks ahead.
3rd party Ad. Not an offer or recommendation by Investing.com. See disclosure here or remove ads.
Which stock should you buy in your very next trade?
AI computing powers are changing the stock market. Investing.com's ProPicks AI includes 6 winning stock portfolios chosen by our advanced AI. In 2024 alone, ProPicks AI identified 2 stocks that surged over 150%, 4 additional stocks that leaped over 30%, and 3 more that climbed over 25%. Which stock will be the next to soar?
Unlock ProPicks AI