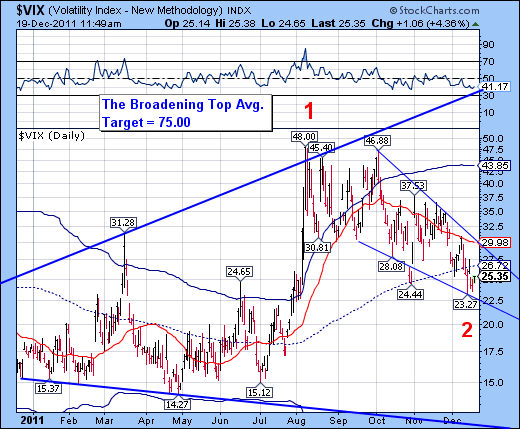
The VIX made a new low which completed a bullish Descending Wedge pattern on December 13. It also completed a Master Cycle low, beginning a new bullish cycle pattern for the VIX. In fact, the new target for the VIX may very well be a breakout above the August high by the end of the year.
SPX closes below its support zone…
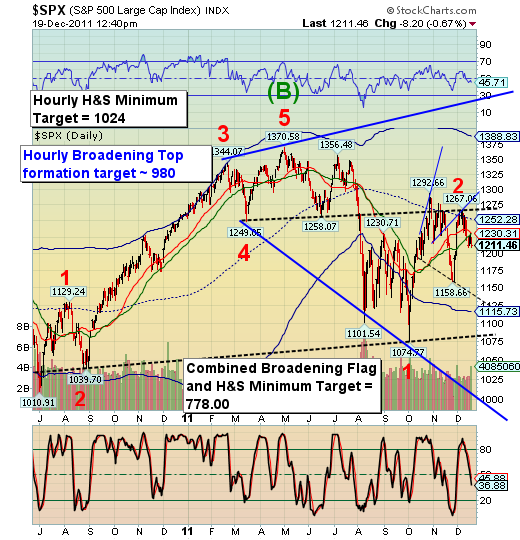
The /SPX decline through all its support zones last week and ended the week with the failed retest of the 50 day moving average at 1228.76 (green line). A close below the 50 day moving average should set off alarms with traders. However, there appear to be moderate buying instead.
The lack of alarm may be attributed to the normal positive seasonality expected at the end of the year in the markets. Or it may be attributed to last week's lows in the VIX, giving a false sense of security and calm. The cycles, however, give a far different picture. The potential for market crash by year-end is very high.
… Ditto the NDX.
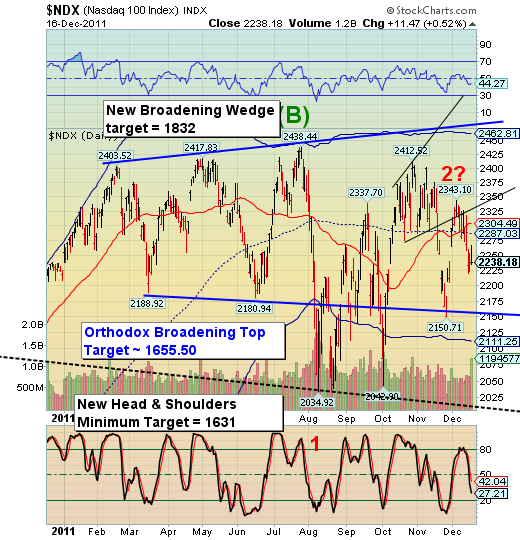
The fact that the NDX is well below 50 day moving average at 2304.49 and below its mid-cycle support/resistance at 2287.03 hardly perturbs the complacency among traders. Friday's attempt at buying the dip failed after the first hour. The attempted save still could not erase nearly a 3.5% loss for the week.
Folks, this is as bearish as it gets. It is very likely that the NDX may be below its August low by year-end. .
3rd party Ad. Not an offer or recommendation by Investing.com. See disclosure here or remove ads.
The Euro has broken its neckline.
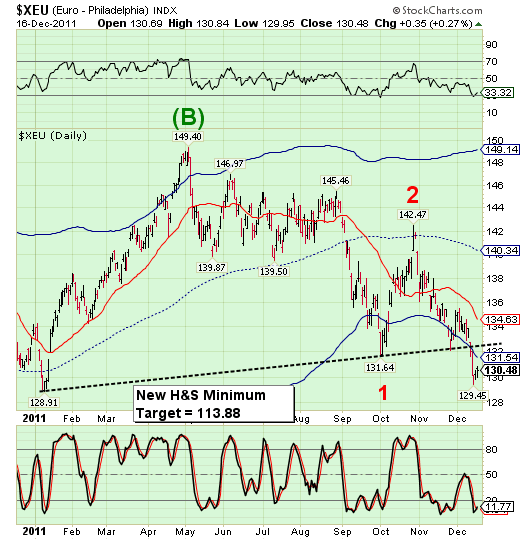
The Euro has broken its Head and Shoulders neckline near 132.40 and is ready to take a plunge towards parity with the dollar. Since early May the Euro has had an increasing correlation with the Standard & Poor's 500 index. There is a strong implication that as the Euro Zone crumbles, so will the financial markets in the United States as well.
The cycles suggest that the Euro may not finish its decline until year-end.
The US Dollar has broken out!
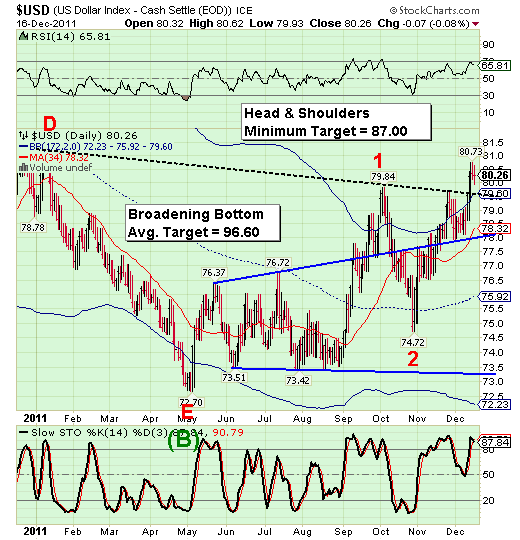
Much to the chagrin of the Euro Zone and hedge funds whose strategy is based on the dollar carry trade, a breakout of its inverted Head and Shoulders pattern has occurred. While I have listed the minimum Head and Shoulders target of 87 on the chart, Head and Shoulders bottoms are quite powerful and may produce rallies as high as 20% or 30%.. (Source: Encyclopedia of Chart Patterns, by Thomas N. Bulkowski, page 276) The Broadening Bottom minimum gain nicely matches the minimum target for the inverted Head and Shoulders pattern with an average 20% gain.
Gold reveals a new Head and Shoulders pattern.
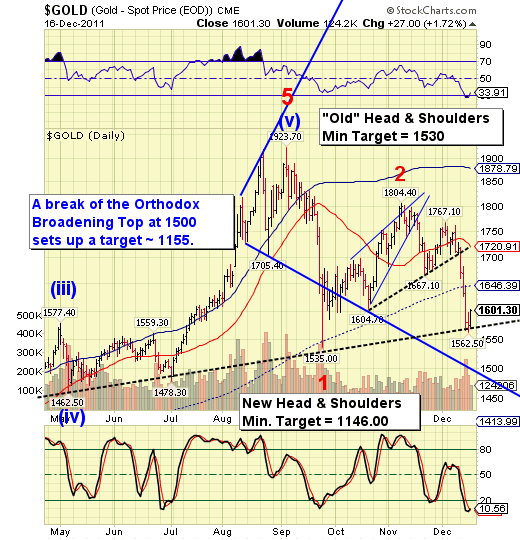
Gold interrupted its decline this week at what appears to be a new Head and Shoulders neckline while completing the right shoulder last week. The cycle model suggests that gold may continue its decline this week to breach its Orthodox broadening top lower trendline at 1500.00. In fact, my model suggests a minimum low this week near 1450.00, if not significantly lower.
3rd party Ad. Not an offer or recommendation by Investing.com. See disclosure here or remove ads.
The current cycle, which calls for a significant low in gold by the end of December, may be wrapping up by the end of this week.
U.S. Bonds remain in positive territory.
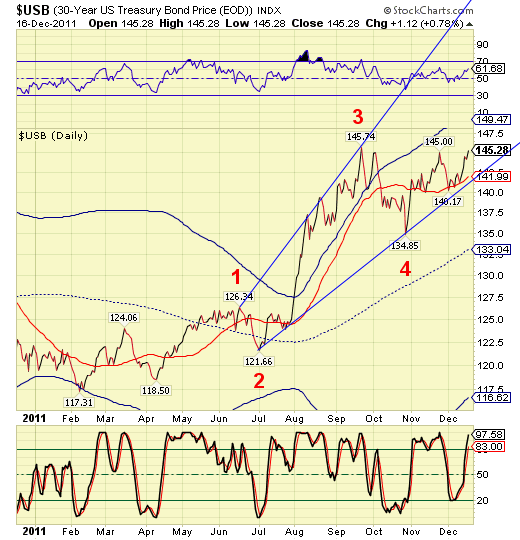
This week USB continues its climb above intermediate-term trend support at 141.99. Treasury bonds remain on a buy signal and appear overbought enough for a strong reversal. However, I remain bullish, since the cycles support the uptrend through the end of January, if not later. In fact, the Broadening Wedge formation strongly suggests an acceleration in the price of USB.
Oil says goodbye to all technical supports.
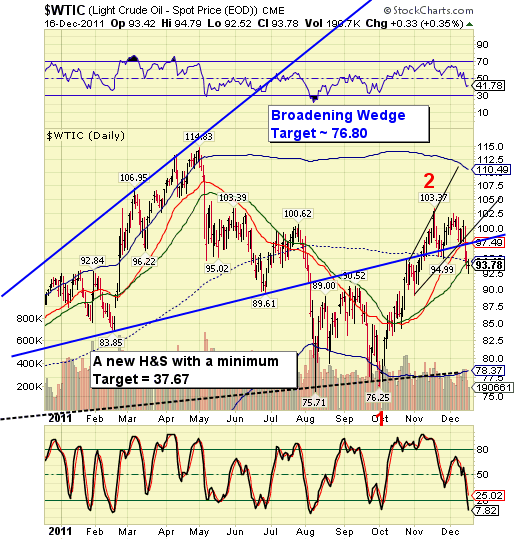
On Thursday West Texas Crude violated its 50 day moving average at 94.46 and its mid-ycle support/resistance at 94.43. The rally attempts to overcome those resistances failed on Friday. Technically, crude has no visible supports until it reaches its cycle bottom support and massive head and shoulders neckline at 78.37.
For the most part, West Texas crude appears to be correlated with our domestic equities. That suggests that oil may be linked with stocks in a decline lasting through the year end. It also appears that oil may be starting a crash pattern along with our domestic equities.
China stocks resumed a crash pattern.
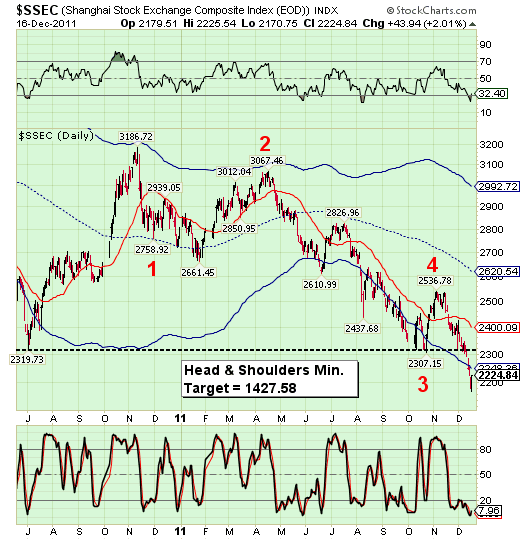
The Shanghai Index failed to hold at its massive Head and Shoulders neckline at 2307.15. As a result, the index has resumed a crash pattern which may last through the end of February. However, since the decline of the Shanghai index began eight months earlier than the declining US equities, it may also be finished much sooner than the decline in equities in the US and Europe.
3rd party Ad. Not an offer or recommendation by Investing.com. See disclosure here or remove ads.
A last ditch effort to save the banks?
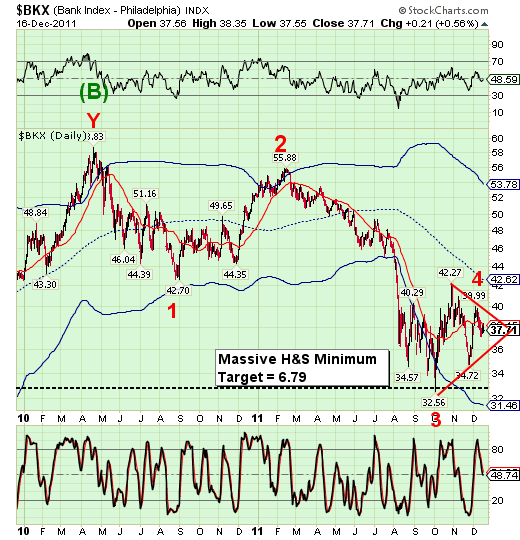
The BKX broke below its intermediate-term trend support/resistance at 38.15. However, should the decline stop at the red trendline at 36.00, we may see one final push higher in the price of BKX into the new year to complete a triangle formation. Triangles form to signal one final advance or decline that follows.
Normally when third waves are extended, fifth waves usually match the width of the triangle or the length of wave 1. In this case, however, a massive head and shoulders pattern is a dead giveaway that the banking index may plunge to single digits. In the meantime, what bankers are left seem to be determined to get their final bonus.
Which stock should you buy in your very next trade?
With valuations skyrocketing in 2024, many investors are uneasy putting more money into stocks. Unsure where to invest next? Get access to our proven portfolios and discover high-potential opportunities.
In 2024 alone, ProPicks AI identified 2 stocks that surged over 150%, 4 additional stocks that leaped over 30%, and 3 more that climbed over 25%. That's an impressive track record.
With portfolios tailored for Dow stocks, S&P stocks, Tech stocks, and Mid Cap stocks, you can explore various wealth-building strategies.
