As the new trading year gets into full swing, one of the questions traders and investors will be asking is whether the initial surge in equities and other risk assets is likely to continue or is merely a temporary reaction to the quasi resolution of the fiscal cliff.
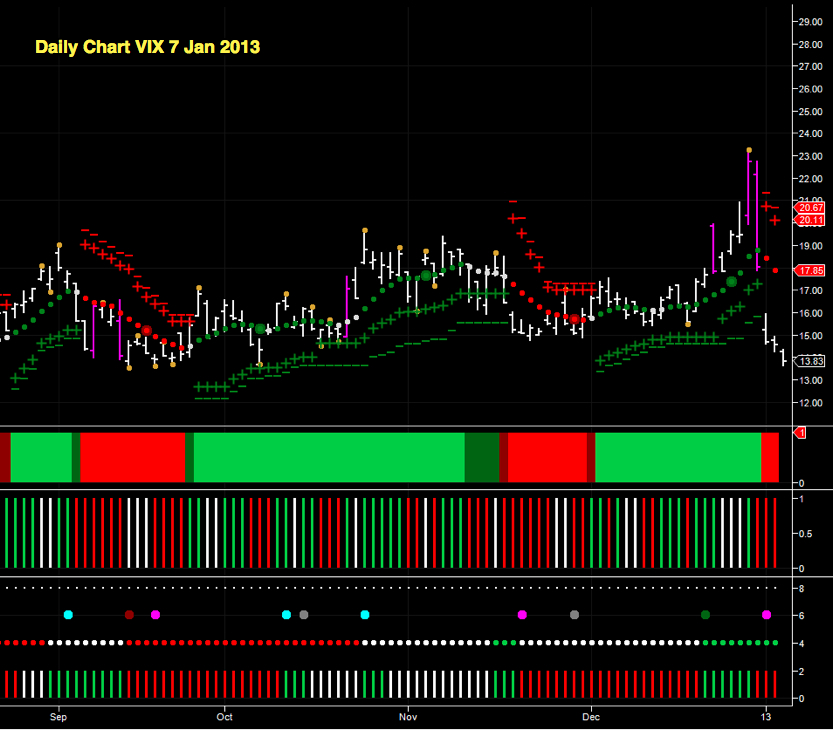
To answer this, we need look no further than the daily chart for the VIX which has generated some interesting signals in the past few days:

Prior to the end of 2012 on the daily chart, we saw the index spike higher on 28th December and hit an intra day high of 23.23, before this was promptly reversed on 31st December with an equally sharp spike lower as the VIX closed the year at 18.02.
The start of the new trading year was marked by a gapped down open which took the VIX to 15.24 with this action breaking through the platform of support in the 15 price area where the index had traded for a substantial period in 2012. The index finally closed on Friday at 13.83.
The index is now poised to test support in the 13.50 region, a price region last seen back in September and here too strong price support awaits. So, the key for any longer term rally in equities now depends on a breach of this level and if broken could see the index move back into single figures.
Moving to volume and trend, volumes on both the daily and three day charts have now transitioned to bearish with a consequent change in trend on the daily chart. However, the three day trend still remains bullish and has yet to transition.
The heatmap has made an immediate change from bullish to bearish to reflect and mirror the reversal of the daily trend, and with the isolated pivot high now posted at 23 this is adding further downward pressure to the index.
To answer this, we need look no further than the daily chart for the VIX which has generated some interesting signals in the past few days:

Prior to the end of 2012 on the daily chart, we saw the index spike higher on 28th December and hit an intra day high of 23.23, before this was promptly reversed on 31st December with an equally sharp spike lower as the VIX closed the year at 18.02.
The start of the new trading year was marked by a gapped down open which took the VIX to 15.24 with this action breaking through the platform of support in the 15 price area where the index had traded for a substantial period in 2012. The index finally closed on Friday at 13.83.
The index is now poised to test support in the 13.50 region, a price region last seen back in September and here too strong price support awaits. So, the key for any longer term rally in equities now depends on a breach of this level and if broken could see the index move back into single figures.
Moving to volume and trend, volumes on both the daily and three day charts have now transitioned to bearish with a consequent change in trend on the daily chart. However, the three day trend still remains bullish and has yet to transition.
3rd party Ad. Not an offer or recommendation by Investing.com. See disclosure here or remove ads.
The heatmap has made an immediate change from bullish to bearish to reflect and mirror the reversal of the daily trend, and with the isolated pivot high now posted at 23 this is adding further downward pressure to the index.
Which stock should you buy in your very next trade?
AI computing powers are changing the stock market. Investing.com's ProPicks AI includes 6 winning stock portfolios chosen by our advanced AI. In 2024 alone, ProPicks AI identified 2 stocks that surged over 150%, 4 additional stocks that leaped over 30%, and 3 more that climbed over 25%. Which stock will be the next to soar?
Unlock ProPicks AI