
Note: The charts in this commentary have been updated to include the Q1 2017 Third Estimate released this morning.
The chart below is a way to visualize real GDP change since 2007. It uses a stacked column chart to segment the four major components of GDP with a dashed line overlay to show the sum of the four, which is real GDP itself. Here is the latest overview from the Bureau of Labor Statistics:
The increase in real GDP in the first quarter primarily reflected positive contributions from nonresidential fixed investment, exports, PCE, and residential fixed investment that were partly offset by negative contributions from private inventory investment, federal government spending, and state and local government spending. Imports, which are a subtraction in the calculation of GDP, increased.
The deceleration in real GDP in the first quarter reflected a downturn in private inventory investment, a deceleration in PCE, and a downturn in state and local government spending that were partly offset by an upturn in exports, an acceleration in nonresidential fixed investment, and a deceleration in imports. [more here]
Let's take a closer look at the contributions of GDP of the four major subcomponents. The data source for this chart is the Excel file accompanying the BEA's latest GDP news release (see the links in the right column). Specifically, it uses Table 2: Contributions to Percent Change in Real Gross Domestic Product.
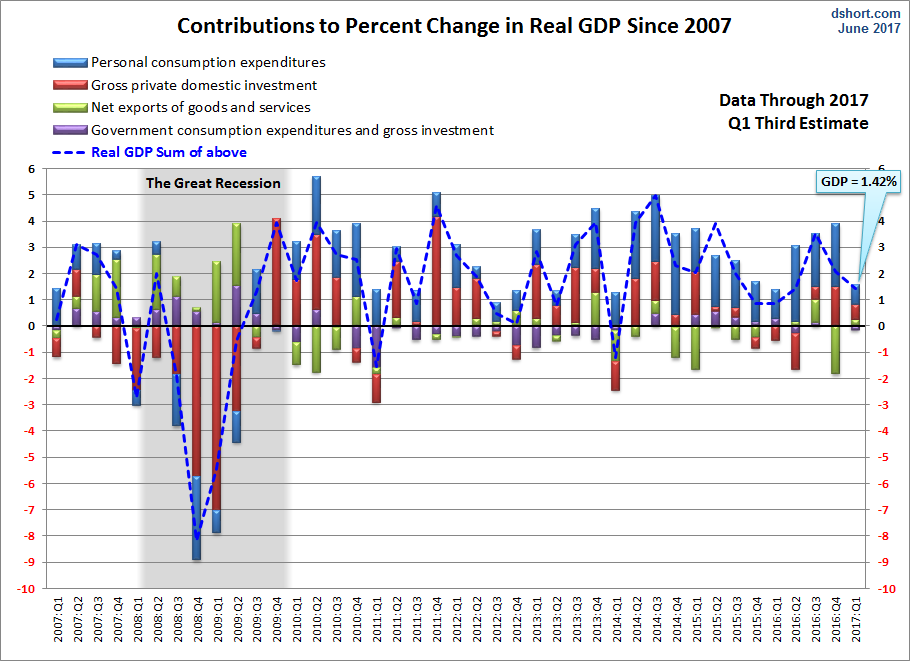
Note: The conventional practice is to round GDP to one decimal place, the latest at 1.4%. The GDP in the chart above is the real GDP calculated to two decimal places.
Over the time frame of this chart, the Personal Consumption Expenditures (PCE) component has shown the most consistent correlation with real GDP itself. When PCE has been positive, GDP has usually been positive, and vice versa. In the latest GDP data, the contribution of PCE came at 0.75 of the 1.4 real GDP, a significant drop over the previous quarter and a major drag on Q1 GDP.
Gross Private Domestic Investment was a small positive contributor.
The negative contribution Net Exports was positive in Q1, but was a fractional contribution.
Government Consumption Expenditures came in slightly negative.
Here is a look at the contribution changes between over the past four quarters. The difference between the two rightmost columns was addressed in the BEA's GDP summary quoted above.
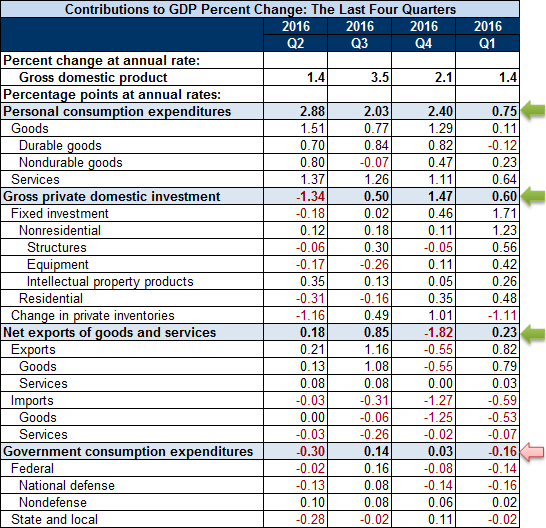
Here is a close look at the revisions for the latest quarter, where we see the steady upward revisions to PCE.

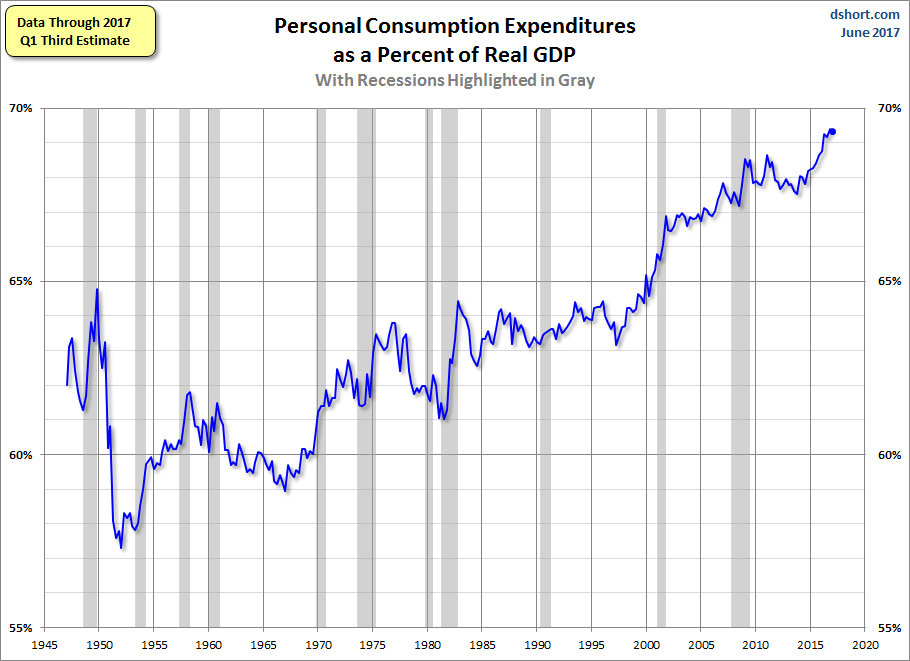
As for the role of Personal Consumption Expenditures (PCE) in GDP and how it has increased over time, here is a snapshot of the PCE-to-GDP ratio since the inception of quarterly GDP in 1947. To one decimal place, the latest ratio of 69.4% is fractionally below the record high. From a theoretical perspective, there is a point at which personal consumption as a percent of GDP can't really go any higher. We may be approaching that upper range.
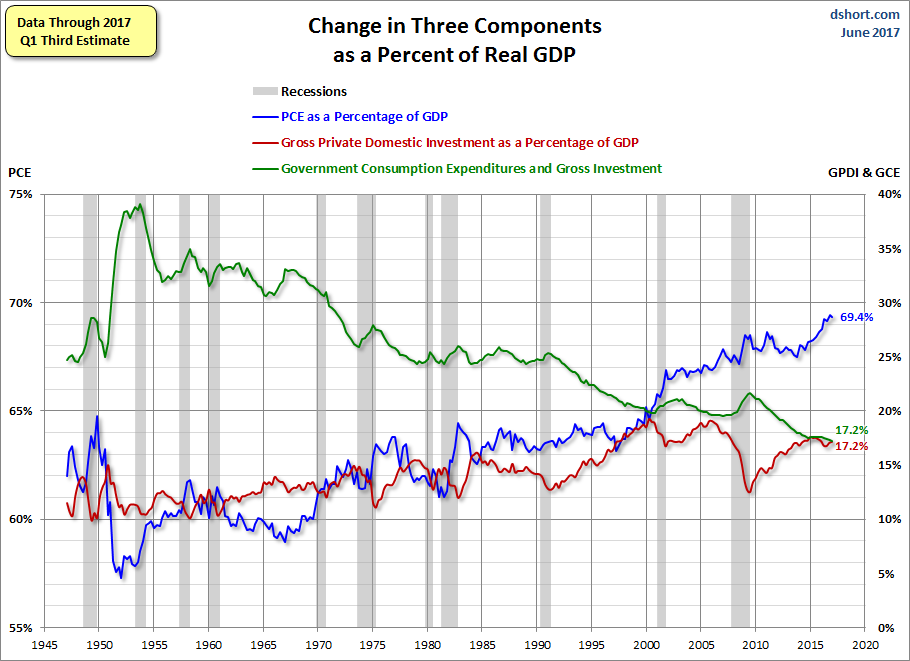
Let's close with a look at the inverse behavior of three of the GPDI components during recessions. PCE and especially GC generally increase as a percent of GDP whereas GPDI declines. Note the three with different vertical axes (Personal Consumption Expenditures on the left, Gross Private Domestic Investment and Government Consumption on the right) to highlight the frequent inverse correlations.
Which stock should you buy in your very next trade?
With valuations skyrocketing in 2024, many investors are uneasy putting more money into stocks. Unsure where to invest next? Get access to our proven portfolios and discover high-potential opportunities.
In 2024 alone, ProPicks AI identified 2 stocks that surged over 150%, 4 additional stocks that leaped over 30%, and 3 more that climbed over 25%. That's an impressive track record.
With portfolios tailored for Dow stocks, S&P stocks, Tech stocks, and Mid Cap stocks, you can explore various wealth-building strategies.