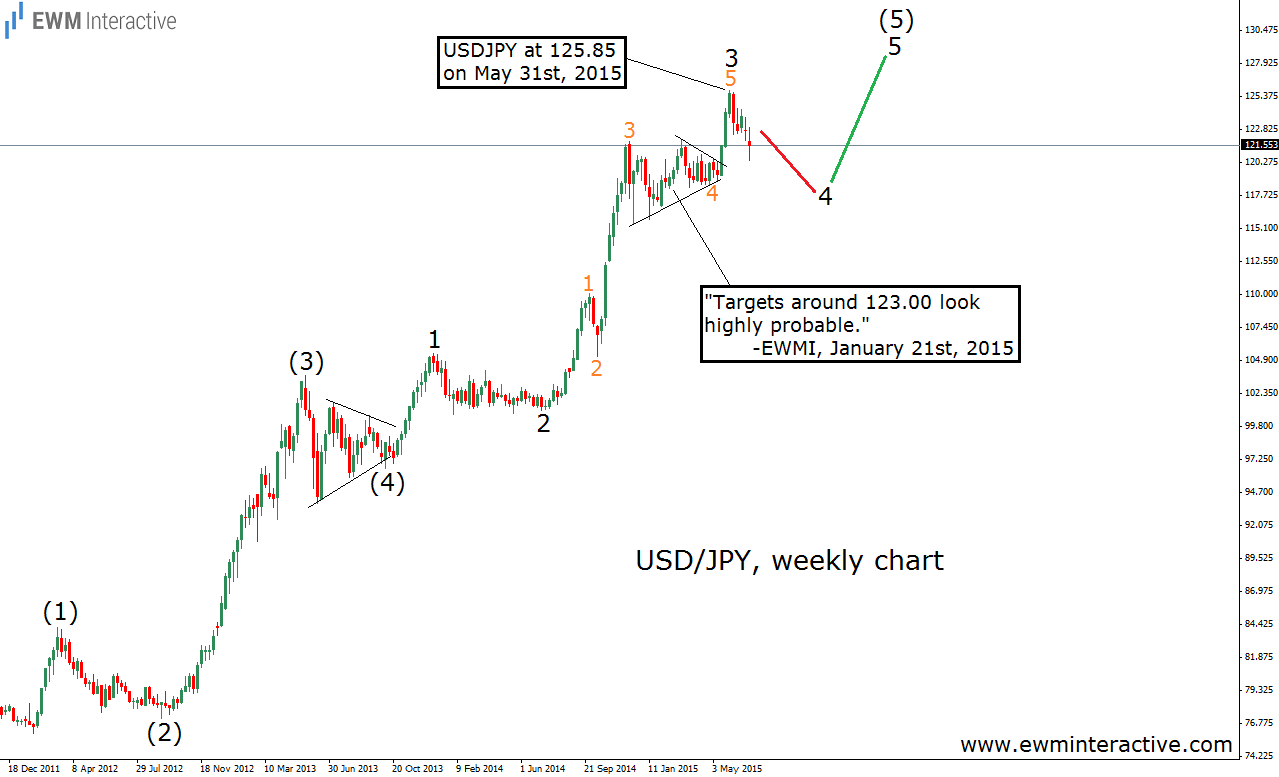
“USD/JPY might lose another 400-500 pips in wave 4 of (5), before wave 5 of (5) to the upside begins. You might want to wait a while, before buying this dip.” This is an excerpt from “USD/JPY Right On Track In 2015″, which we published on July 9th, 2015, when USD/JPY was trading near 121.50. In other words, we were expecting the pair to visit the area between 117.50 and 116.50. The chart below shows how the forecast looked like back then.
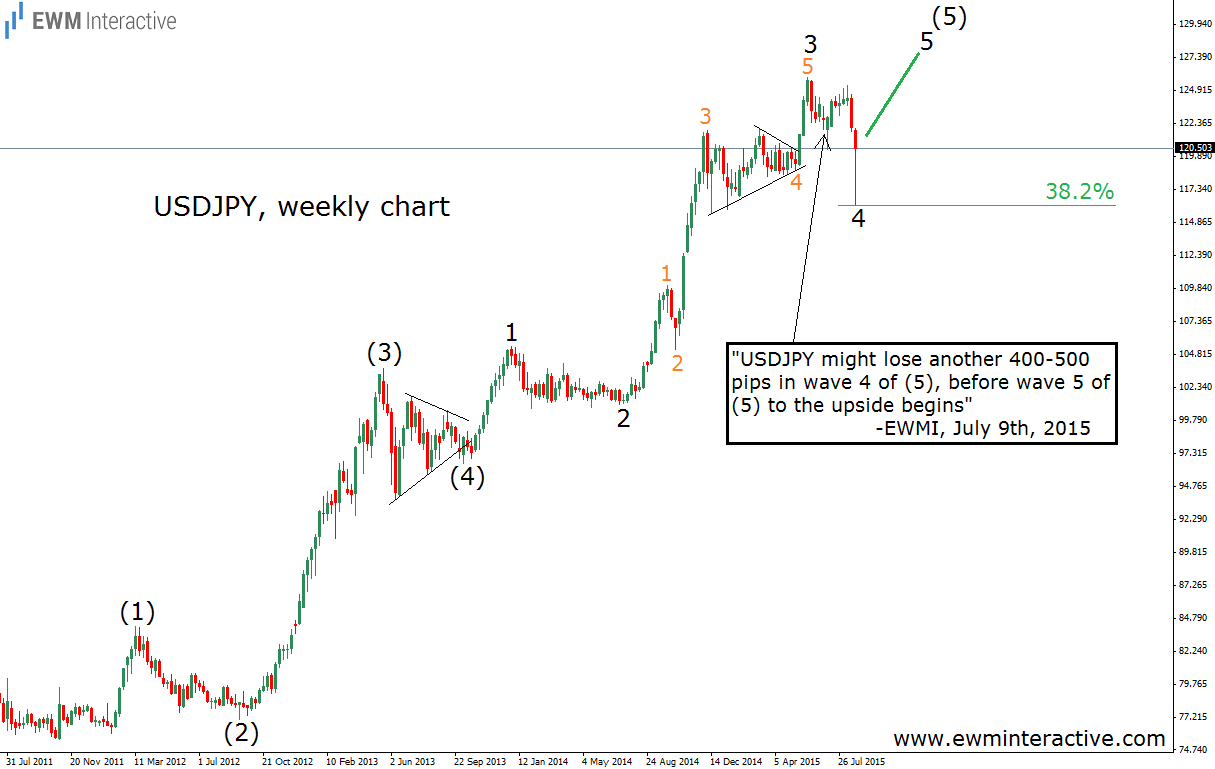
Soon as the article was published, the pair rose to 125.28. However, the top 125.85 was never touched. Instead, USD/JPY started falling as expected. On August 24th, the “Black Monday”, the dollar plunged to as low as 116.15 against the Japanese yen. This is 35 pips beyond our second target. Not bad at all. The Elliott Wave Principle proved its value once again. An updated chart is given below.
By the way, note where the recent sell-off in wave 4 of (5) ended – precisely at the 38.2% Fibonacci retracement level. It turns out the market is mathematically organized, even in the panics, huh?
From now on, USD/JPY should continue higher in the face of the anticipated wave 5 of (5). Naturally, the bulls are supposed to take the pair above the previous high of 125.85, unless a truncation occurs.
Which stock should you buy in your very next trade?
AI computing powers are changing the stock market. Investing.com's ProPicks AI includes 6 winning stock portfolios chosen by our advanced AI. In 2024 alone, ProPicks AI identified 2 stocks that surged over 150%, 4 additional stocks that leaped over 30%, and 3 more that climbed over 25%. Which stock will be the next to soar?
Unlock ProPicks AI