Bitcoin price today: hits record high over $122k ahead of ’crypto week’
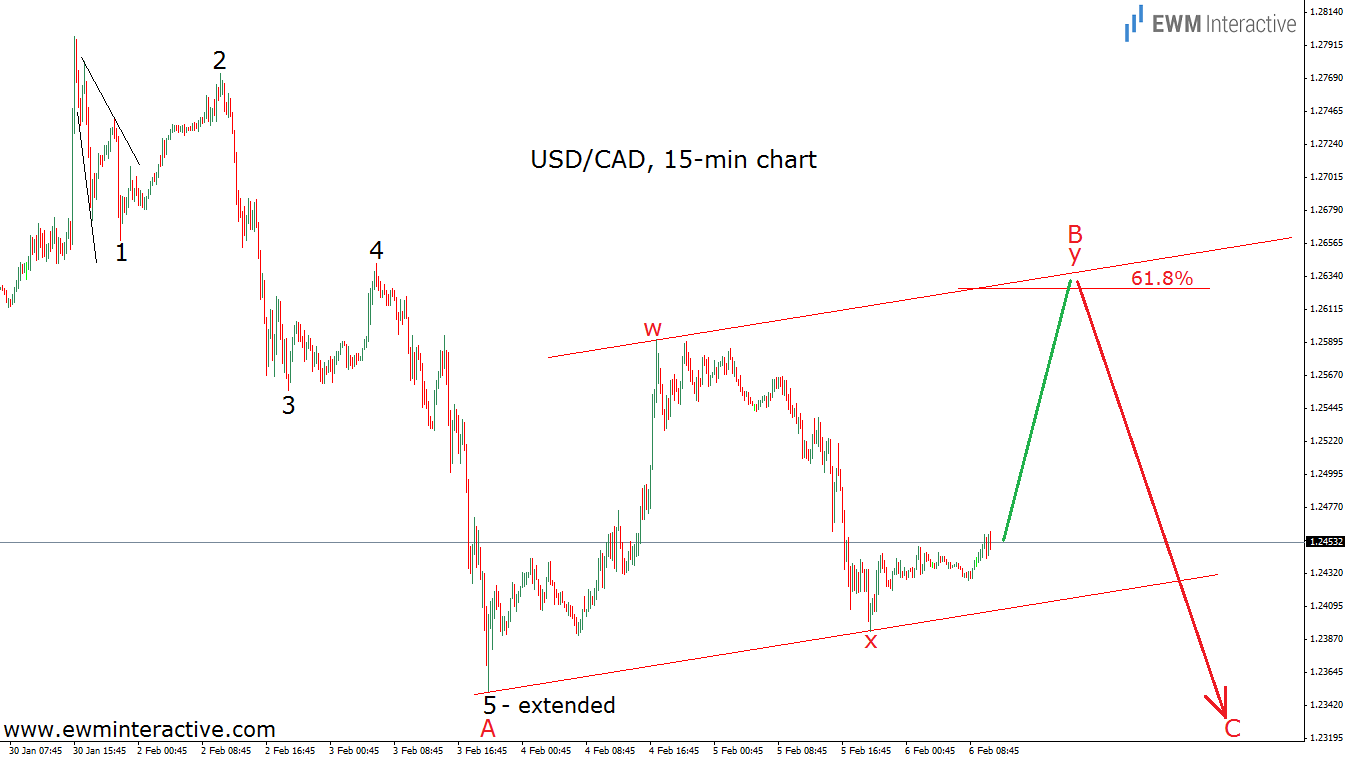
In our last forecast of USD/CAD we said, that it is probably in the middle of a correction. So, we assumed that once it is finished, the pair should head down again in the face of wave C. The chart below visualizes this idea.
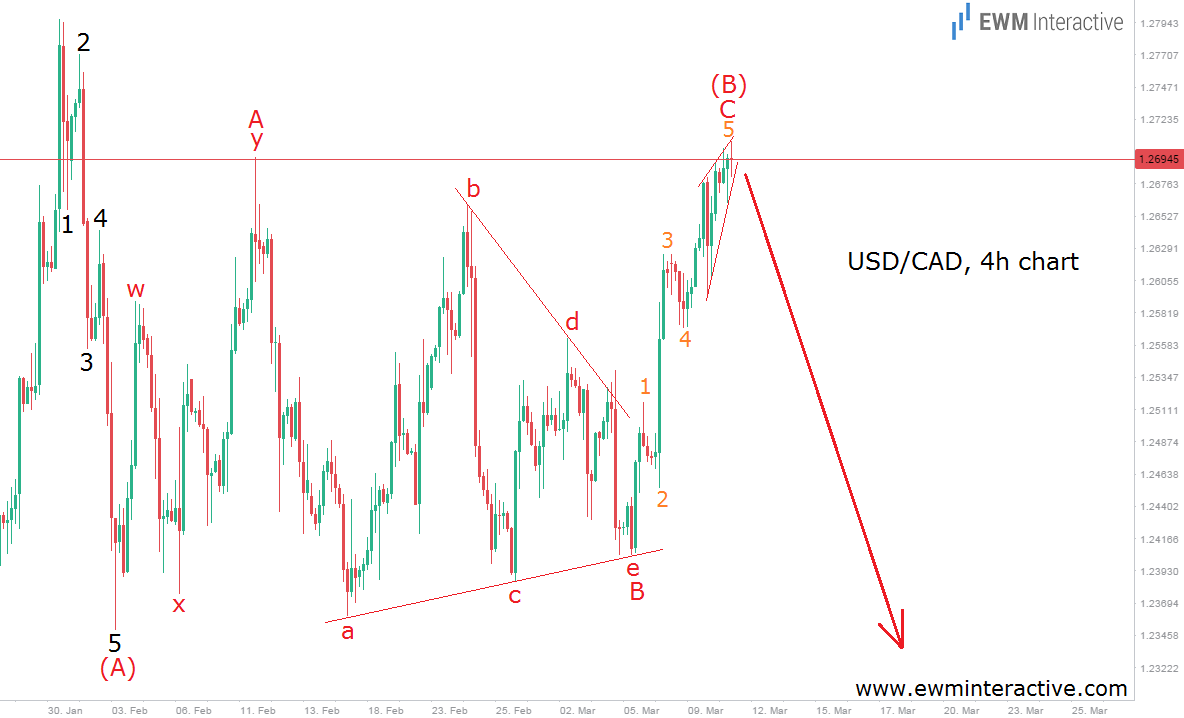
If you have been following USD/CAD, you know how things went. The w-x-y double zig-zag developed exactly as it should. After that, there was a sharp decline from 1.2696 to 1.2361. However, this sell-off did not made a new bottom, so it was not wave C. Instead, the exchange rate has been consolidating. Today it reached slightly above 1.2700. This appears to be giving us another selling opportunity, because the original invalidation level is still untouched at 1.28. After a little relabeling, the new bearish count looks like this:
The impulsive wave (A) from 1.28 to 1.2350 suggests, that all the price action after it is a correction. To be more precise, wave (B) seems to be an unusual flat, where wave B is a triangle. If this count is correct, we should prepare for another large decline, which should finally manage to make a new bottom below 1.2350. In other words, the bears could take USD/CAD some 350 pips down or even more.
Which stock should you buy in your very next trade?
With valuations skyrocketing in 2024, many investors are uneasy putting more money into stocks. Unsure where to invest next? Get access to our proven portfolios and discover high-potential opportunities.
In 2024 alone, ProPicks AI identified 2 stocks that surged over 150%, 4 additional stocks that leaped over 30%, and 3 more that climbed over 25%. That's an impressive track record.
With portfolios tailored for Dow stocks, S&P stocks, Tech stocks, and Mid Cap stocks, you can explore various wealth-building strategies.
