Stock market today: S&P 500 slumps as Trump tariff blitz triggers bloodbath
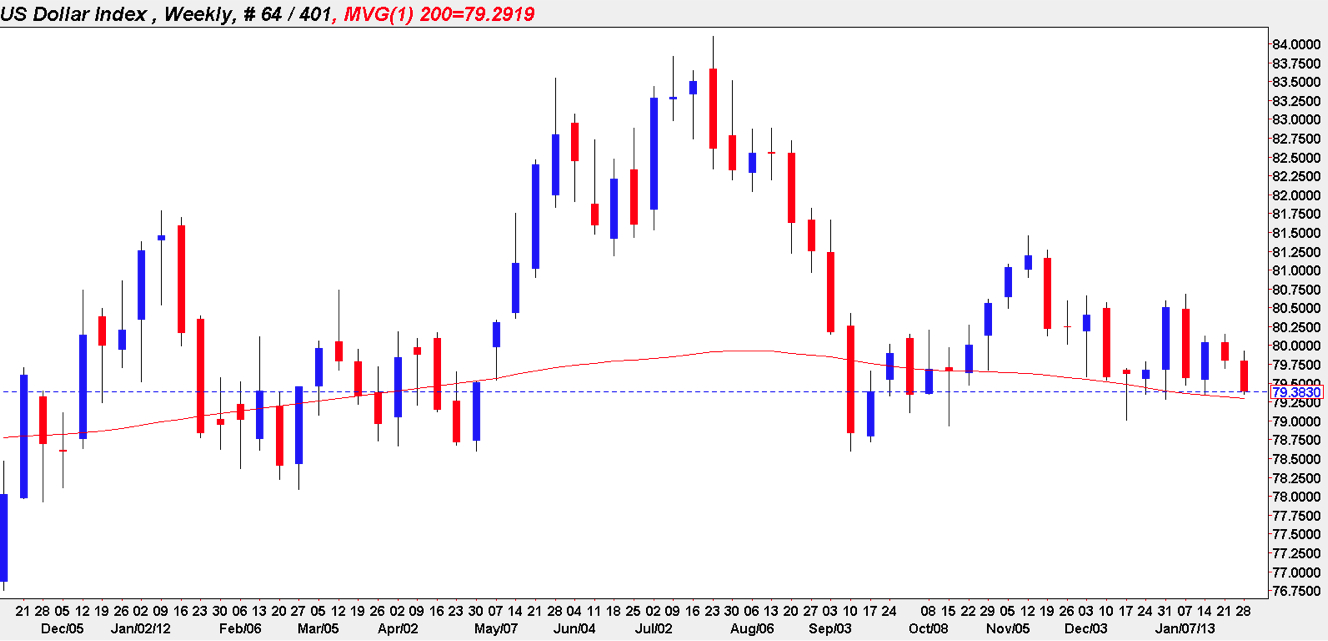
Given the raft of heavyweight fundamental data expected this week and which starts today in the US with the ADP employment numbers, advance Q4 GDP and topped off with the FOMC statement, I thought it would be useful to consider the weekly chart for the USD index and which is now approaching some key levels.

Since early September the dollar index has oscillated between 81.50 to the upside and the 78.75 to the downside where it has remained firmly entrenched during the recent bullish phase for the euro and equities. So far this week the index has once again been trading within this price band but with a bearish slant and is now once again testing the 79.25 floor of price support created since late December 2012.
What is particularly interesting is that the index is now once again at the 200 week moving average which sits at the 79.29 price point and which to date, has provided a strong platform from which the index has recovered in earlier pullbacks.
The next three days of trading will be significant, starting with today, and from a technical perspective the first key point to make is a break and hold below the 200 day ma. Should this occur then expect to see a deeper move down to test the 78.99 level of late December , followed by a test of deeper support at the 78.75 region. In addition, and of particular significance, are the lower highs now in place following the November high of 81.47 and the subsequent failure in January at 80.66.
In summary, not only is the USD index approaching a key technical indicator but it is also looking fragile on the weekly chart.

Since early September the dollar index has oscillated between 81.50 to the upside and the 78.75 to the downside where it has remained firmly entrenched during the recent bullish phase for the euro and equities. So far this week the index has once again been trading within this price band but with a bearish slant and is now once again testing the 79.25 floor of price support created since late December 2012.
What is particularly interesting is that the index is now once again at the 200 week moving average which sits at the 79.29 price point and which to date, has provided a strong platform from which the index has recovered in earlier pullbacks.
The next three days of trading will be significant, starting with today, and from a technical perspective the first key point to make is a break and hold below the 200 day ma. Should this occur then expect to see a deeper move down to test the 78.99 level of late December , followed by a test of deeper support at the 78.75 region. In addition, and of particular significance, are the lower highs now in place following the November high of 81.47 and the subsequent failure in January at 80.66.
3rd party Ad. Not an offer or recommendation by Investing.com. See disclosure here or remove ads.
In summary, not only is the USD index approaching a key technical indicator but it is also looking fragile on the weekly chart.
Which stock should you buy in your very next trade?
With valuations skyrocketing in 2024, many investors are uneasy putting more money into stocks. Unsure where to invest next? Get access to our proven portfolios and discover high-potential opportunities.
In 2024 alone, ProPicks AI identified 2 stocks that surged over 150%, 4 additional stocks that leaped over 30%, and 3 more that climbed over 25%. That's an impressive track record.
With portfolios tailored for Dow stocks, S&P stocks, Tech stocks, and Mid Cap stocks, you can explore various wealth-building strategies.
