With ‘Fiscal Cliff’ all over the news headlines and investors waiting to push the right button when news regarding the upcoming agreement are announced, markets trade near the edge of their ‘cliff’.

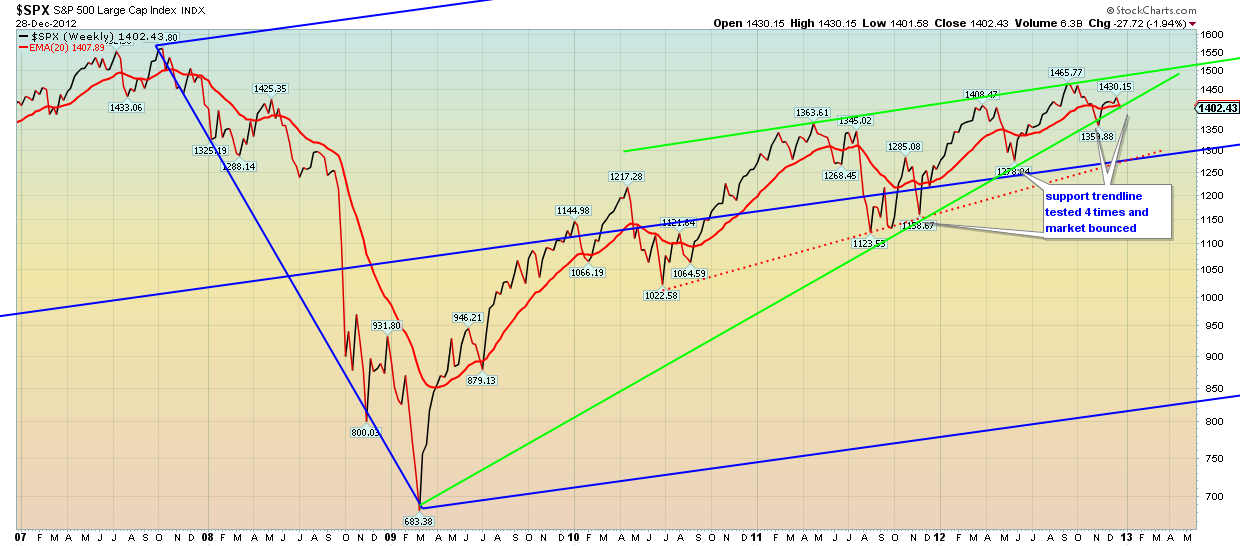
The S&P 500 is once again testing the green upward sloping trend line as shown in the weekly chart above. Crossing once more the red EMA combined with a break under the green trend line, could generate a selling panic, specially if news regarding the agreement come out negative.
I usually don’t expect a piece of news to come out to trade, but in situations like this, it is certain whatever the outcome, volatility is going to rise. If you followed our previous posts regarding the S&P 500, our first alert for bulls was signaled when prices broke the short term upward trend line at 1425.

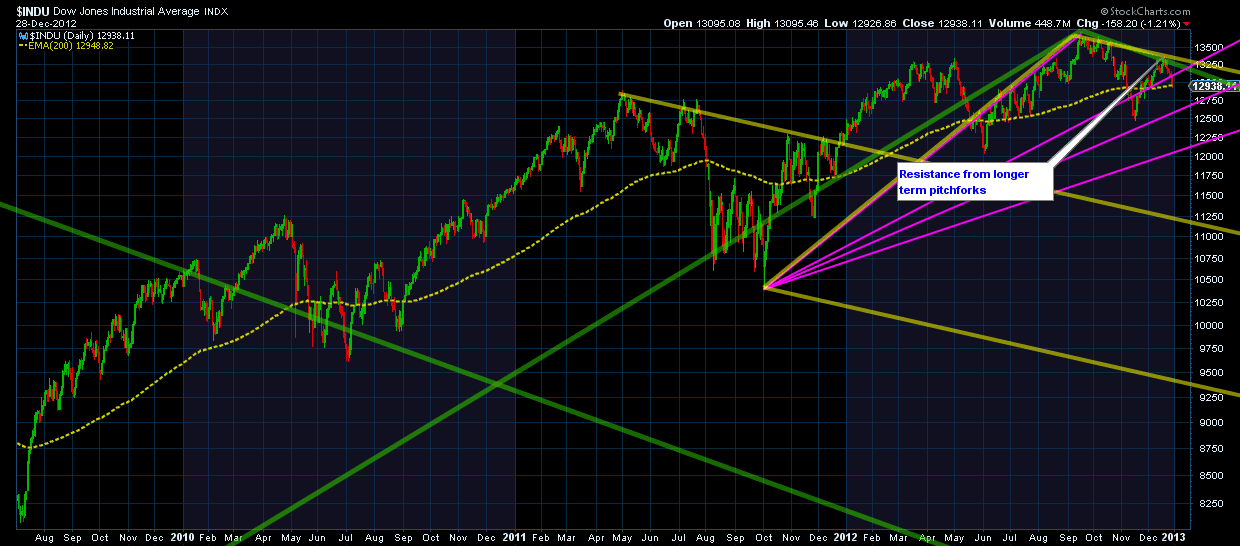
The Dow however, had a better and clearer bullish picture than the S&P 500, though it did not manage to complete a clear 5 wave move from 12471. As shown above in the weekly chart, prices got rejected at our longer term upper pitchfork resistance. If prices don’t manage to overcome this barrier, then bulls must be ready for a steep decline. Support is found at 12850 and 12750.
Disclosure: None of the information or opinions expressed in this blog constitutes a solicitation for the purchase or sale of any security or other instrument. Nothing in this article constitutes investment advice and any recommendations that may be contained herein have not been based upon a consideration of the investment objectives, financial situation or particular needs of any specific recipient. Any purchase or sale activity in any securities or other instrument should be based upon your own analysis and conclusions.

The S&P 500 is once again testing the green upward sloping trend line as shown in the weekly chart above. Crossing once more the red EMA combined with a break under the green trend line, could generate a selling panic, specially if news regarding the agreement come out negative.
I usually don’t expect a piece of news to come out to trade, but in situations like this, it is certain whatever the outcome, volatility is going to rise. If you followed our previous posts regarding the S&P 500, our first alert for bulls was signaled when prices broke the short term upward trend line at 1425.

The Dow however, had a better and clearer bullish picture than the S&P 500, though it did not manage to complete a clear 5 wave move from 12471. As shown above in the weekly chart, prices got rejected at our longer term upper pitchfork resistance. If prices don’t manage to overcome this barrier, then bulls must be ready for a steep decline. Support is found at 12850 and 12750.
Disclosure: None of the information or opinions expressed in this blog constitutes a solicitation for the purchase or sale of any security or other instrument. Nothing in this article constitutes investment advice and any recommendations that may be contained herein have not been based upon a consideration of the investment objectives, financial situation or particular needs of any specific recipient. Any purchase or sale activity in any securities or other instrument should be based upon your own analysis and conclusions.
3rd party Ad. Not an offer or recommendation by Investing.com. See disclosure here or remove ads.
Which stock should you buy in your very next trade?
AI computing powers are changing the stock market. Investing.com's ProPicks AI includes 6 winning stock portfolios chosen by our advanced AI. In 2024 alone, ProPicks AI identified 2 stocks that surged over 150%, 4 additional stocks that leaped over 30%, and 3 more that climbed over 25%. Which stock will be the next to soar?
Unlock ProPicks AI