Trump has once again backed semiannual reporting. What could this mean for stocks?
Talking Points:
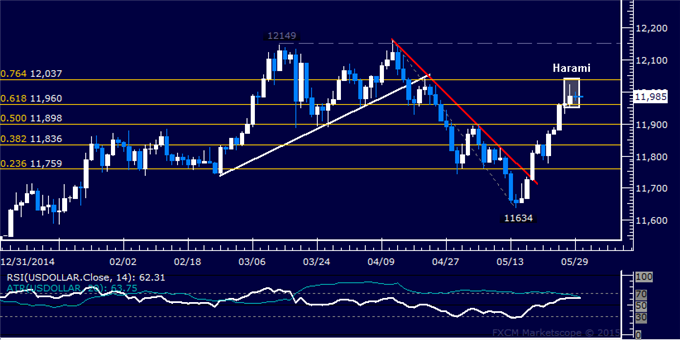
- US Dollar Technical Strategy: Holding Long via Mirror Trader Basket **
- Support: 11960, 11898, 11836
- Resistance: 12037, 12149, 12214
The Dow Jones FXCM US Dollar Index put in a Harami candlestick pattern, hinting a move lower may be ahead. A daily close below the 61.8% Fibonacci retracement at 11960 exposes the 50% level at 11898. Alternatively, a move above the 76.4% Fib at 12037 clears the way for a test of the March 13 high at 12149.
We remain broadly bullish on the US dollar against its leading counterparts in line with our long-term fundamental outlook. As such, we remain long via the Mirror Trader US Dollar currency basket.

Which stocks should you consider in your very next trade?
The best opportunities often hide in plain sight—buried among thousands of stocks you'd never have time to research individually.
That's why smart investors use our Stock Screener with 50+ predefined screens and 160+ customizable filters to surface hidden gems instantly.
For example, the Piotroski's Picks method averages 23% annual returns by focusing on financial strength, and you can get it as a standalone screen. Momentum Masters catches stocks gaining serious traction, while Blue-Chip Bargains finds undervalued giants.
With screens for dividends, growth, value, and more, you'll discover opportunities others miss. Our current favorite screen is Under $10/share, which is great for discovering stocks trading under $10 with recent price momentum showing some very impressive returns!
