U.S. inflation data released yesterday by the Bureau of Labor Statistics show that a two-month spike in headline inflation seems to have run its course. Both headline and core inflation measures are now close to or below the Fed’s 2 percent target. In a related development, the Atlanta Fed reports that deflation probabilities have nosedived since President Obama won re-election earlier this month.
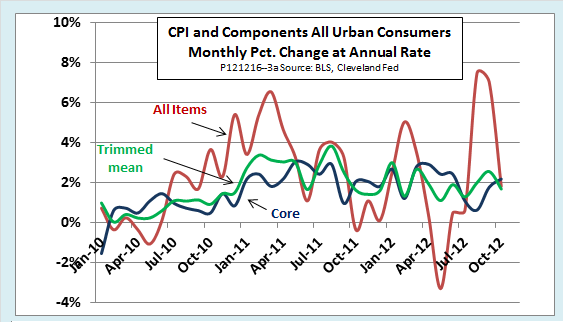
The headline all-items CPI increased at an annual rate of just 1.81 percent in October, down from 7.48 percent in August and 7.06 percent in September. Most of the decrease came from a drop in energy prices, which had soared in the previous two months. New and used car prices also fell. Increases in the prices of food and apparel partly offset the decreases in energy and vehicles.
Measures of underlying inflation, which had not followed the late-summer spike of the all-items CPI, remained moderate. The BLS core CPI, which excludes food and energy prices, increased at a 2.18 annual rate in October. The Cleveland Fed’s 16-percent trimmed mean inflation rate increased at annual rate of 1.69 percent. The trimmed mean measure of underlying inflation excludes the 8 percent of prices that increase the most in a given month and also the 8 percent of prices that increase least (or decrease most), whether they are energy, food, or anything else. The following chart shows all three measures.
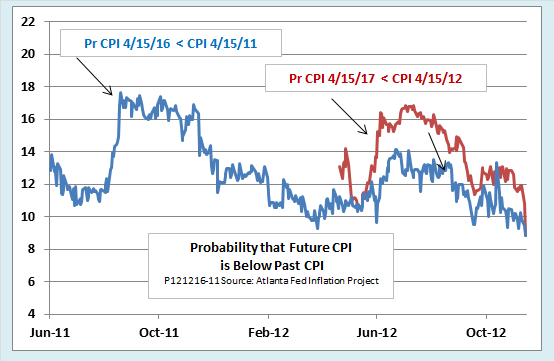
Meanwhile, an indicator of deflation probability published by the Atlanta Fed has nosedived since the election. The probability that the CPI on April 15, 2017 will be below its level of April 15, 2012 fell from 11.52 percent the day before the election to 8.81 percent on November 14th. The decrease could be interpreted as indicating that investors believe President Obama will safely steer the economy through the recession risk posed by political gridlock and the fiscal cliff.
The Atlanta Fed calculates the probability of inflation over a five-year interval by comparing the prices of newly issued Treasury Inflation Protected Securities (TIPS) with those of previously issued TIPS having similar maturities. The methodology is based on the fact that newly issued TIPS of a given maturity offer a slightly greater degree of deflation protection than those issued earlier. As the chart shows, the risk of deflation is now at its lowest level in more than a year.
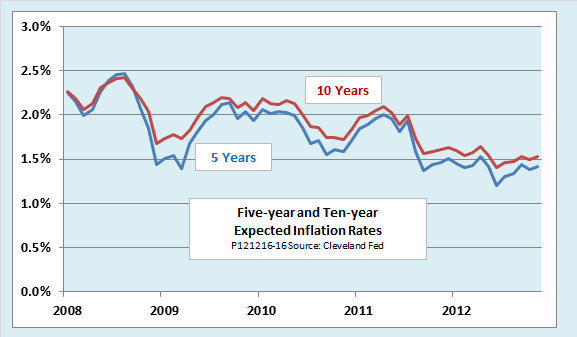
TIPS prices can also be used to estimate expected inflation. The method used by the Cleveland Fed tries to measure expectations for various time horizons while, at the same time, isolating the element in expected TIPS prices that represents a risk premium rather than future inflation. The next chart gives their five- and ten-year expected inflation rates. The fact that expectations of both inflation and deflation are falling suggests growing confidence that monetary and fiscal policymakers will neither plunge the economy into a new depression nor allow an outbreak of inflation. However, note that both the five-year and ten-year expected inflation rates are well below the Fed’s target of 2 percent. That implies market participants do not expect the Fed’s current program of quantitative easing to meet its objectives in full and on schedule.
Original post
Which stock should you buy in your very next trade?
With valuations skyrocketing in 2024, many investors are uneasy putting more money into stocks. Unsure where to invest next? Get access to our proven portfolios and discover high-potential opportunities.
In 2024 alone, ProPicks AI identified 2 stocks that surged over 150%, 4 additional stocks that leaped over 30%, and 3 more that climbed over 25%. That's an impressive track record.
With portfolios tailored for Dow stocks, S&P stocks, Tech stocks, and Mid Cap stocks, you can explore various wealth-building strategies.
