EU and US near trade deal with 15% tariffs - FT
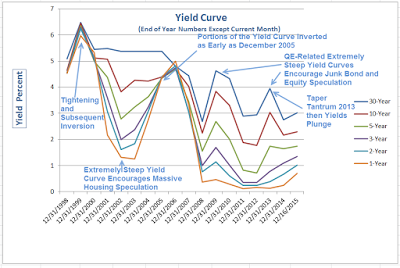
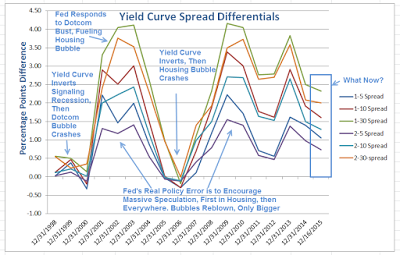
In my post this morning on Yield Curve and Spreads: Fed's Real Policy Error in Pictures; What's Next? there were two important points I intended to make but didn't. First here's a repeat of two charts.
Yield Curve 1998-2015 (Year-End Values)

Click on either chart for sharper image.
Values for 2015 are from the December 16 close, the day the Fed hiked.
Yield Curve Differentials 1998-2015 (Year-End Values)

Two Important Points
- The tightening of the yield curve so early in the lead-up and initial stage of Fed rate hikes is both unprecedented and recessionary-looking.
- It’s highly likely that tightening reflects bond market concerns about a slowing economy and various economic bubbles that are about to pop.
If the economy was strengthening as widely believed, the yield curve ought to be widening, not collapsing.
Greenspan's first hike in four years was on 2004-06-30. Check out the yield curve and differentials ahead of and right after that hike. Compare to today.
Those who believe the yield curve must invert before a recession hits, need to think about those two important points in addition to taking a look at recession in Japan.
A recession without a preceding yield curve inversion has not happened in the US before, but neither have yield spread differentials collapsed in the initial stages of a Fed tightening cycle.
Which stock should you buy in your very next trade?
With valuations skyrocketing in 2024, many investors are uneasy putting more money into stocks. Unsure where to invest next? Get access to our proven portfolios and discover high-potential opportunities.
In 2024 alone, ProPicks AI identified 2 stocks that surged over 150%, 4 additional stocks that leaped over 30%, and 3 more that climbed over 25%. That's an impressive track record.
With portfolios tailored for Dow stocks, S&P stocks, Tech stocks, and Mid Cap stocks, you can explore various wealth-building strategies.
