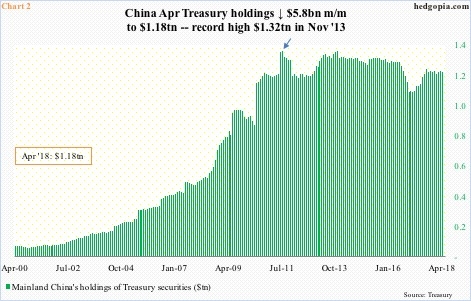
China’s holdings of Treasury securities fell $5.8 billion month-over-month in April to $1.18 trillion. It remains the largest holder of these securities. In China versus the US, if the current trade spat turns into a trade war, these securities could turn out to be the Asian nation’s trump card.
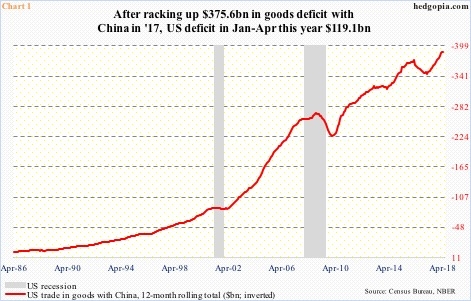
Chart 1 is at the heart of the ongoing tariff tit for tat between China and the US. In 2017, the former ran $375.6 billion in trade surplus (goods only) with the latter. In the first four months this year, this was $119.1 billion. This is a huge number, and has persistently grown over the years. In 1985, the surplus was only $6 billion.
The Trump administration wants China to cut the surplus – by $200 billion by 2020. China has agreed to cut it, but would not commit to a target. Trump has imposed tariffs on $50 billion worth of Chinese goods, which will go into effect July 6. China retaliated with its own tariffs on $50 billion worth of US goods. Too soon to say if we are looking at the early days of Smoot-Hawley, but there are signs the prevailing tension between the world’s two largest economies is having an impact elsewhere.
Between January and May this year, Chinese acquisitions and investments in the US nosedived 92 percent to just $1.8 billion, according to Rhodium Group. Including divestitures, net Chinese deal flow to the US during the period was minus $7.8 billion. Rhodium also points out that completed Chinese deals in the US hit a record $46 billion in 2016, which fell to $29 billion in 2017. The trend is not going the right direction. US sovereign bond bulls hope this sentiment does not begin to seep into a very important section of the global bond market.
As mentioned earlier, China holds $1.18 trillion in US Treasury securities (as of April). Japan is second at $1.03 trillion. China’s peaked at $1.32 trillion in November 2013 (arrow in Chart 2), and has since trended sideways to slightly down. Being the largest holder of these securities, they wield power. Particularly so if the current trade spat turns into a trade war. In this unfortunate scenario, these holdings could very well turn out to be China’s ace up its sleeve – even more so as US deficit in all probability is on its way up.
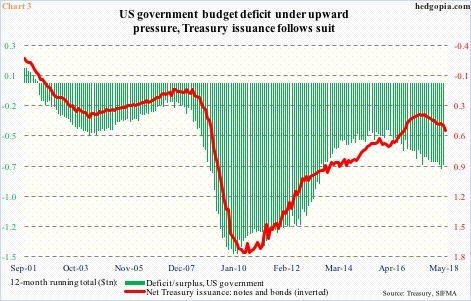
The US economy is one week from completing nine years of recovery. Throughout all this, the US government ran a deficit. After bottoming at $403.6 billion in January 2016, the 12-month running total of deficit trended higher, with April at $706.8 billion.
This probably gets worse. The Tax Cuts and Jobs Act of 2017, signed into law last December, is a $1.5-trillion tax-cutting package. This was followed by a $300-billion federal spending increase. Treasury issuance is already headed higher. In May, on a 12-month basis, $494 billion was issued in notes and bonds, up from $335 billion last July (Chart 3). Thus China’s clout in this market. It recycles its trade surplus into Treasury securities. In the long run, this could very well turn out to be China’s trump card – if a spat today evolves into a war tomorrow.
Thanks for reading!


