
USD/MXN is trading slow and choppy in a contracting range, which looks like an ongoing Elliott wave triangle in wave four, so we think that weakness will resume after a-b-c-d-e completed sub-waves. Price can now be in wave d that can look for some temporary support around the lower trendline of the pattern.
For a mid-term perspective we are bearish, and looking beneath June levels.
USD/MXN 4h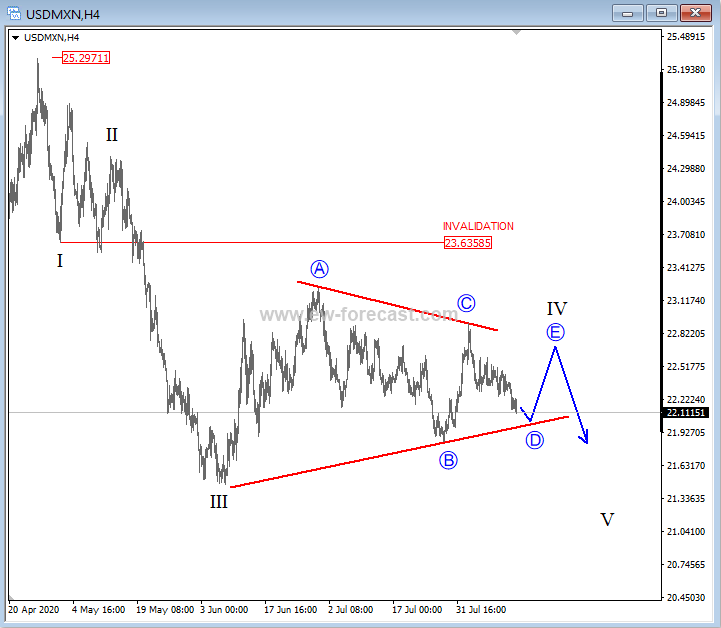
A triangle is a common 5-wave pattern labeled A-B-C-D-E that moves counter-trend and is corrective in nature. Triangles move within two channel lines drawn from waves A to E, and from waves B to D. A triangle is either contracting or expanding depending on whether the channel lines are converging or expanding. Triangles are overlapping five wave affairs that subdivide 3-3-3-3-3.
Triangles can occur in wave 4, wave B, wave X position or in some very rare cases also in wave Y of a combination.
Symmetrical triangle in downtrend.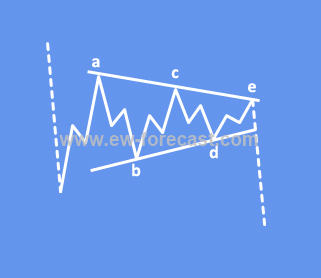
Which stock should you buy in your very next trade?
AI computing powers are changing the stock market. Investing.com's ProPicks AI includes 6 winning stock portfolios chosen by our advanced AI. In 2024 alone, ProPicks AI identified 2 stocks that surged over 150%, 4 additional stocks that leaped over 30%, and 3 more that climbed over 25%. Which stock will be the next to soar?
Unlock ProPicks AI