Grok 4 is here and analyst says ’don’t bet against Elon’
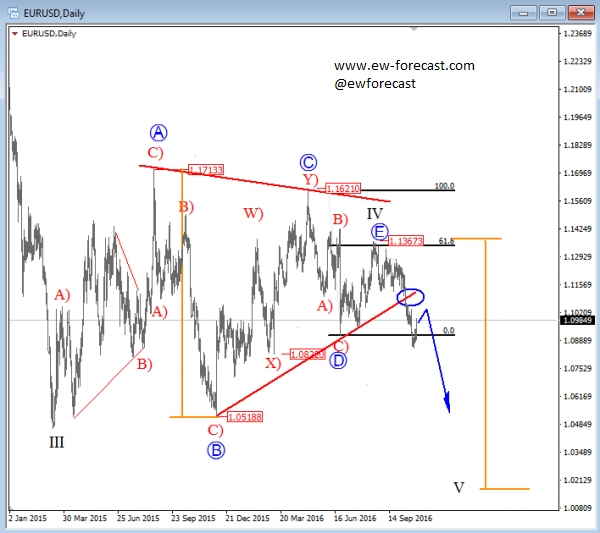
On EUR/USD we see price trapped in a big consolidation pattern, a triangle pattern that seems to be over as of recent bearish price movement. It's a five wave correction, a continuation pattern that can after its completion push price lower into a strong decline. At the moment we see price trading beneath the lower red trendline, suggesting that the final wave E is finished and now more weakness may come in play.
If that is the case then lower levels will follow and another but decisive break beneath the wave swing D will ideally happen, which will be the second confirming price action for more weakness ahead down into wave V.
EUR/USD, Daily
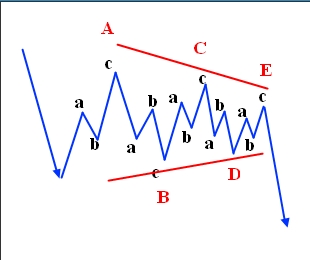
A Triangle is a common 5 wave pattern labeled A-B-C-D-E that moves counter-trend and is corrective in nature. Triangles move within two channel lines drawn from waves A to C, and from waves B to D.
A Triangle is either contracting or expanding depending on whether the channel lines are converging or expanding. Triangles are overlapping five wave affairs that subdivide 3-3-3-3-3.
Basic Triangle Correction:
Which stock should you buy in your very next trade?
AI computing powers are changing the stock market. Investing.com's ProPicks AI includes 6 winning stock portfolios chosen by our advanced AI. In 2024 alone, ProPicks AI identified 2 stocks that surged over 150%, 4 additional stocks that leaped over 30%, and 3 more that climbed over 25%. Which stock will be the next to soar?
Unlock ProPicks AI

