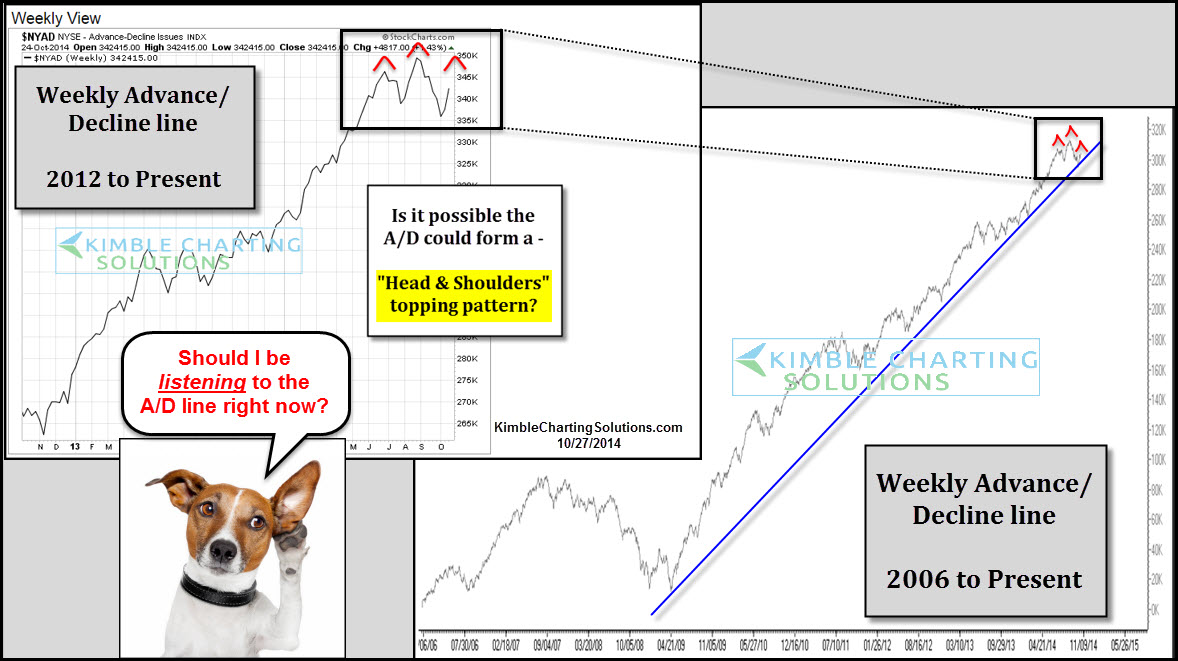
When it comes to Advance/Decline line patterns and listening to its messages, I am a big fan of watching support lines and watching to see if the A/D line is diverging against the broad markets. As you can see in the right chart, the A/D line remains above support dating back to the 2009 lows (a positive) and it has not had a big divergence against the broad markets for years. Last multi-month divergence was back in 2007!
On a short-term basis I am watching to see if the A/D line could be making a 'Head & Shoulders' topping pattern (left chart). Humbly, I am not a huge fan of this type of pattern being applied to the A/D line. I do respect the pattern enough that I will listen to it and respect its potential, until this pattern proves differently.
Which stock should you buy in your very next trade?
AI computing powers are changing the stock market. Investing.com's ProPicks AI includes 6 winning stock portfolios chosen by our advanced AI. In 2024 alone, ProPicks AI identified 2 stocks that surged over 150%, 4 additional stocks that leaped over 30%, and 3 more that climbed over 25%. Which stock will be the next to soar?
Unlock ProPicks AI
