Trump slaps 30% tariffs on EU, Mexico
After turning neutral in January and then bullish in early February, the Asset Inflation-Deflation Trend Model has moved back to a neutral position, indicating that my model portfolio should take some risk off the table.
To give more color to the change, consider the view from the three Axis of Growth, namely China, Europe and the United States. I would characterize the outlook for China as the most cautious; Europe as moving from bullish to greater uncertainty; and the US as experiencing slow and steady growth.
A cautious Chinese outlook
As regular readers know, the Trend Model relies primarily on commodity prices as an indicator of global growth and inflationary expectations. Commodity prices have been rolling over, as shown by the chart of the CRB Index below.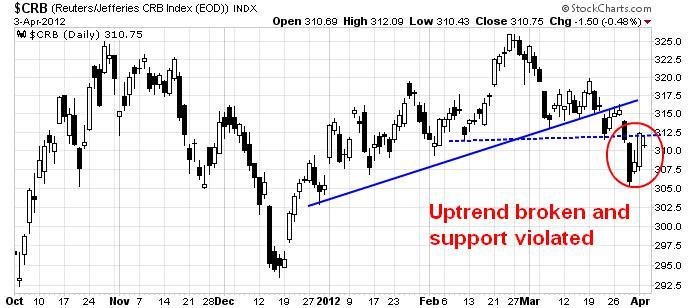
The commodity complex is highly sensitive to Chinese growth and there have been much concern about the near term trajectory of China's growth outlook. Indeed, a glance at the Shanghai Composite confirms the level of investor nervousness as that index as moved into a minor downtrend.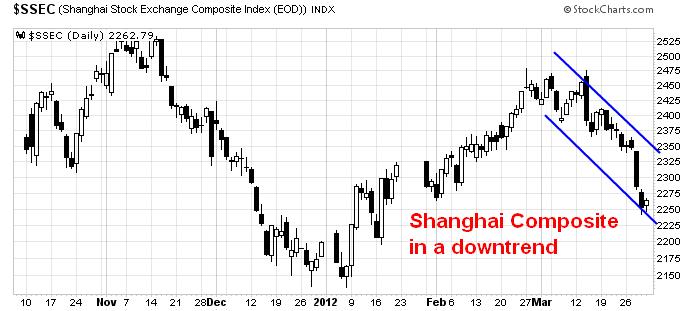
Next in Hong Kong, the Hang Seng Index has confirmed the weakness observed elsewhere as that index is in the process of breaking a key technical support level.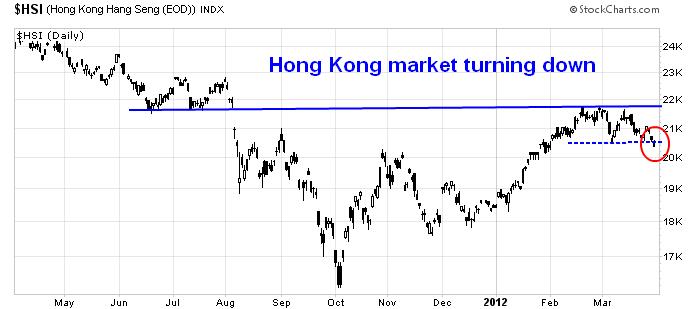
Similarly, the commodity and Chinese growth sensitive Australian Dollar is in a downtrend, indicating weakness. 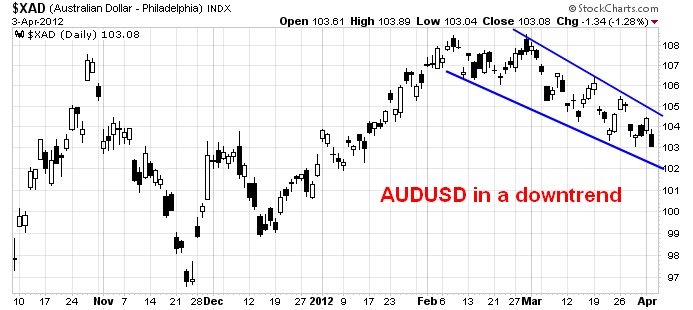
I could go on, but you get the idea about the market judgement of China's near-term growth outlook.
More uncertainty in Europe
In Europe, the ECB's action through the use of LTRO has removed the immediate threat of a banking meltdown. As a result, the markets have enjoyed a relief rally that began late last year.
In the short term, however, much of the good news appears to have been priced into equities. As I indicated last week (see Europe takes one step back?), worries about Spain are beginning to surface and the normal back-and-forth negotiations are showing up on the stage of European Theatre. The latest act is now beginning to spook investors.
The European equity indices have broken down out of the uptrend that began late last year and appear to be consolidating sideways. Note that this is not necessarily bearish, but a sign that the markets need to either correct or digest its gains from last winter.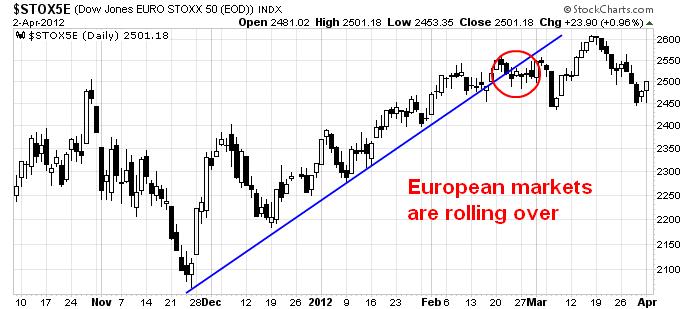
Other signs of stress are showing up in Europe. The chart below shows the relative performance of European Financials against the market. After rallying through a relative downtrend in January, which would indicate that a Crash is off the table because of ECB support, the sector began to consolidate sideways. Most recently, the Financials exhibited a relative technical breakdown, which is a sign that the market believes that financial stress is rising again.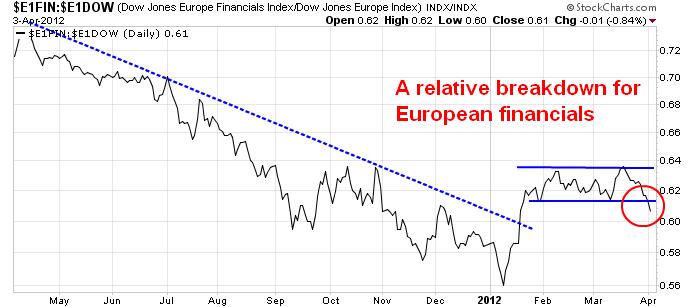
America: Steady as she goes
Across the Atlantic, US equities continue to hum along and grind upward in a steady and well-defined uptrend.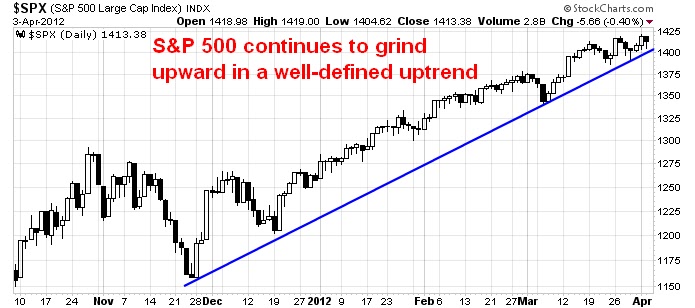
I pointed out that the health of this bull has changed from being dependent on central bank liquidity to one that depends on the American consumer (see This bull depends on the US consumer). The chart of Consumer Discretionary stocks relative to the market shows that this sector remains the market leaders - and the health of this bull depends on the American consumer.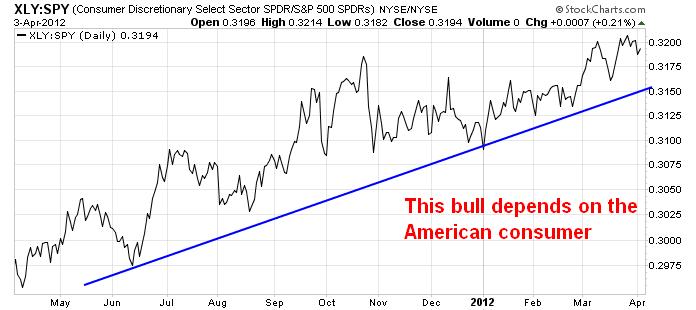
(This chart also underlines the importance of the NFP release this Friday to the continued health of this equity bull.)
What does this all mean?
Putting it all together, I interpret the model readings as telling that of the three regions, one is strong (US), one is consolidating (Europe) and the third is weak (China). This is not a sign to panic, but to become more neutral in your asset allocation and risk budgeting decisions. Within the riskier portions of the portfolio, I would be inclined to tactically tilt towards US and US Dollar denominated asset classes.
Which stock should you buy in your very next trade?
With valuations skyrocketing in 2024, many investors are uneasy putting more money into stocks. Unsure where to invest next? Get access to our proven portfolios and discover high-potential opportunities.
In 2024 alone, ProPicks AI identified 2 stocks that surged over 150%, 4 additional stocks that leaped over 30%, and 3 more that climbed over 25%. That's an impressive track record.
With portfolios tailored for Dow stocks, S&P stocks, Tech stocks, and Mid Cap stocks, you can explore various wealth-building strategies.
