Bitcoin price today: muted at $118k but altcoins soar as House passes new bills
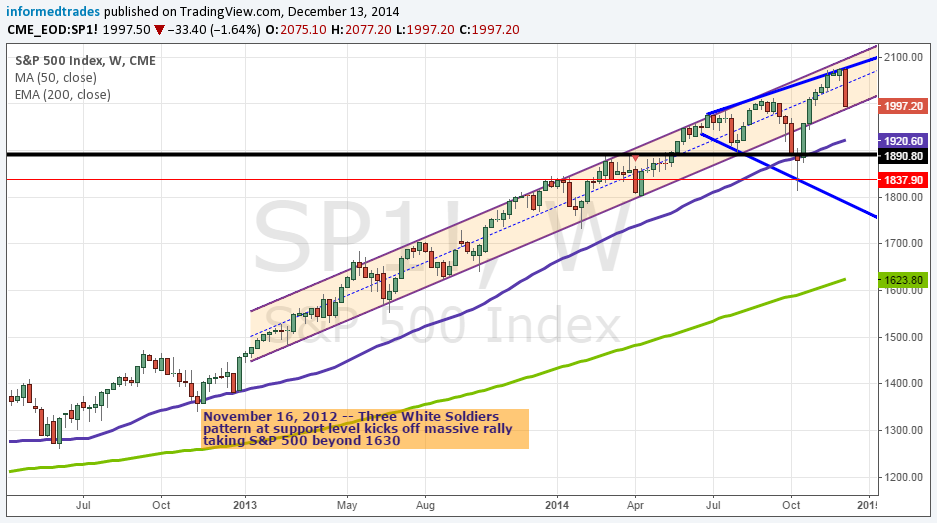
Below is a weekly chart of the S&P 500. What stands out a bit is the last candle, which represents the price action over the past week. It was the largest weekly high-to-low decline since June 17 of 2013 -- just shy of 18 months ago.
This decline puts us at the bottom of the weekly channel going back to mid-January of 2013. However, that channel was broken in the down move that occurred in the week of October 6, 2014 -- a weekly decline that was almost as large as the decline we saw this week. That setup a megaphone pattern, illustrated by the blue trendlines on the chart, that we also discussed previously. If that pattern plays out and this week's decline is a step in that direction, that gives us a downside target of around 1770.
Personally, I think it would be a good time to take some profits on, but leave some on as I think equities could still go much higher if capital flees bonds over the next few years.
What do you think?
Which stock should you buy in your very next trade?
AI computing powers are changing the stock market. Investing.com's ProPicks AI includes 6 winning stock portfolios chosen by our advanced AI. In 2024 alone, ProPicks AI identified 2 stocks that surged over 150%, 4 additional stocks that leaped over 30%, and 3 more that climbed over 25%. Which stock will be the next to soar?
Unlock ProPicks AI
