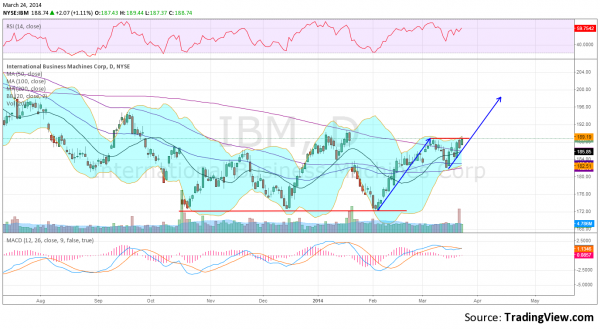
International Business Machines (NYSE:IBM) was knocked back after its last earnings report, finding support at 172, a level where it has twice prior been since October. Since then the stock has rebounded and filled the gap from January.
If you missed that run then you are in luck. The daily chart shows it testing resistance with a breakout above, targeting a Measured Move to 198. The Relative Strength Index (RSI) is rising and the MACD is about to cross up, and both are supporting the upside.
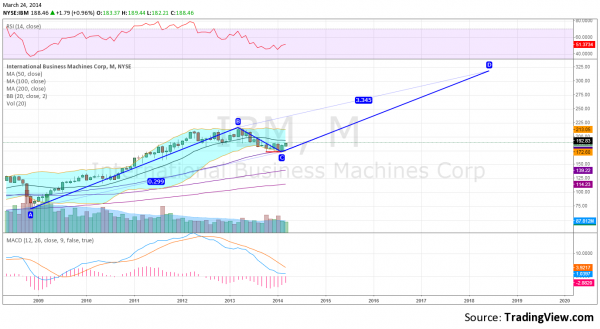
But as we head into month-end, a look at the monthly chart suggests it might just be getting started. The same triple bottom is in red and if it reverses higher, as in that daily chart, an AB=CD pattern kicks in. This targets a move to 318.40 by June 2018. It becomes more reliable as it breaks above the previous high, point B at 216. The momentum indicators are supportive on this timeframe as well with the RSI turning back higher and the MACD leveling at the prior low. Look for the short term trade to lead you into a longer term opportunity.
Disclosure: The information in this blog post represents my own opinions and does not contain a recommendation for any particular security or investment. I or my affiliates may hold positions or other interests in securities mentioned in the Blog, please see my Disclaimer page for my full disclaimer.


