Trump says he will sue Wall Street Journal, NewsCorp, over Epstein letter report
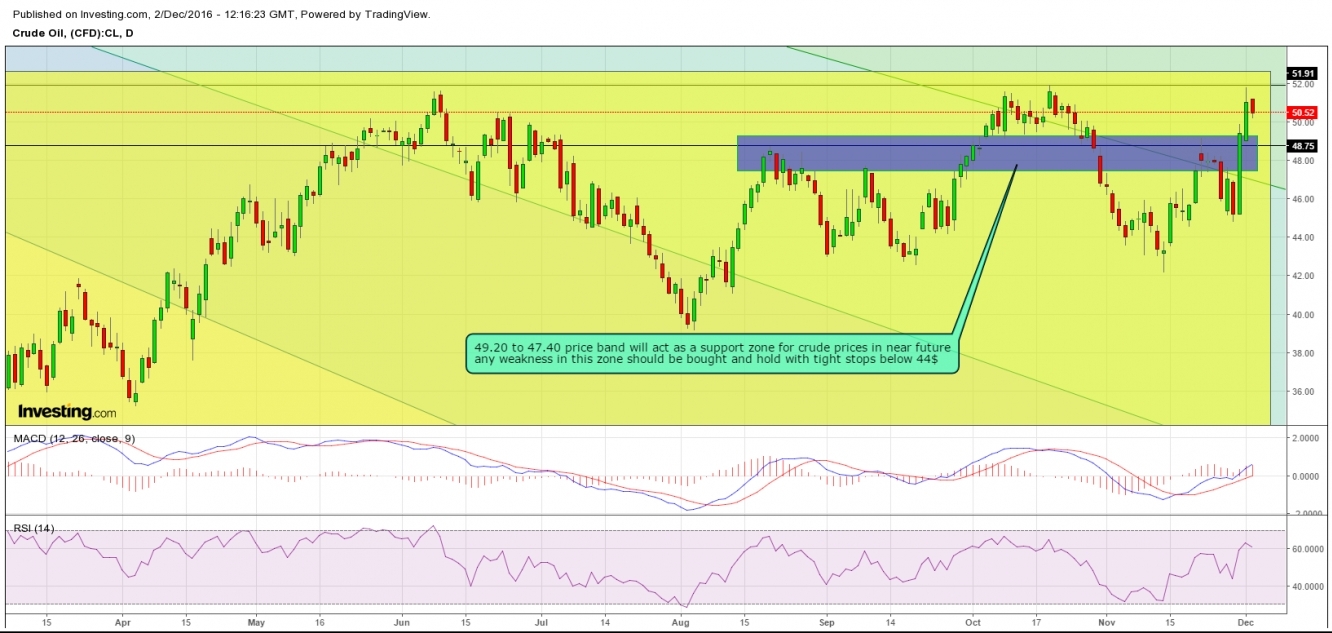
Here is what I said on 2nd December, the daily chart of that day, regenerated here:
Nothing special to add here as whatever I expected in crude Oil technically is so far looking right to me. It holds well above the area of 49.20 and printed a low of 49.45 only.
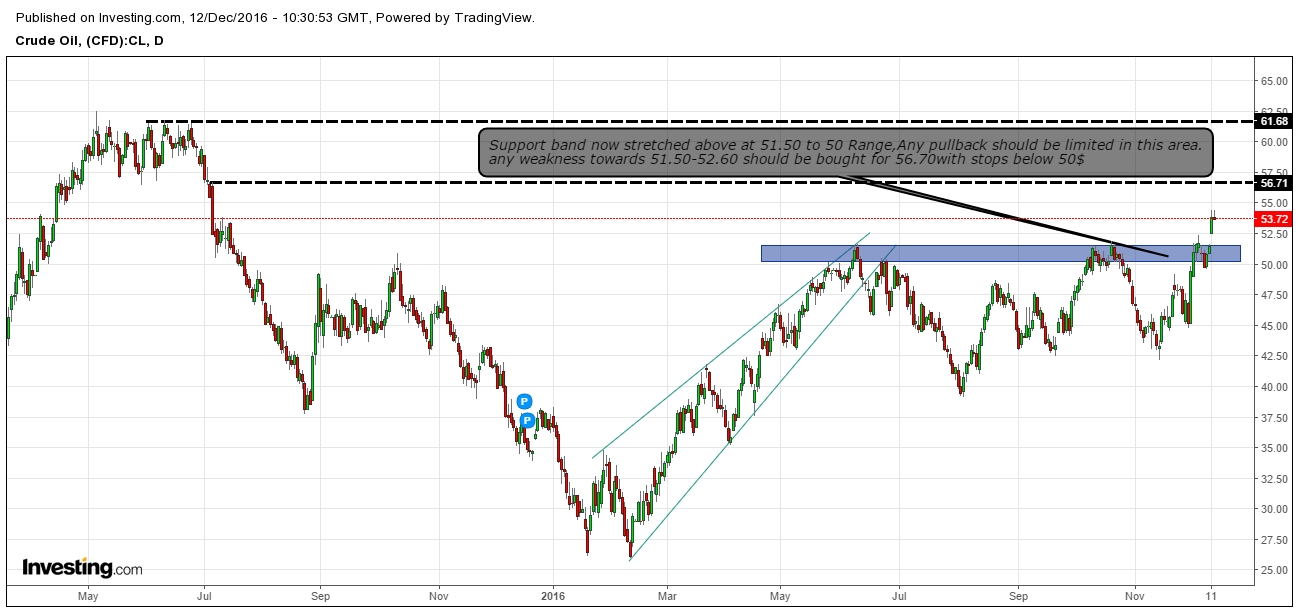
Technically I was expecting the break and sustained movement above 52 which has played out today so far. Here is the latest daily chart of crude oil:
Technically, the daily chart will face first significant Resistance now around 56.71-58.00 zone from where we can expect some reasonable pullback to give another round of buying and a slight ease from overbought position to get normal till that time.
Outlook is bullish, accumulation on any further decline will be my strategy as I am sticking with my same target area of $62 followed by $68 and $72 in the coming months.
Resistance: 55.00 / 56.72
Support : 52.40 / 51.50
Any type of negativity is expected only below the 52.00-49.40.00 zone.
Which stock should you buy in your very next trade?
With valuations skyrocketing in 2024, many investors are uneasy putting more money into stocks. Unsure where to invest next? Get access to our proven portfolios and discover high-potential opportunities.
In 2024 alone, ProPicks AI identified 2 stocks that surged over 150%, 4 additional stocks that leaped over 30%, and 3 more that climbed over 25%. That's an impressive track record.
With portfolios tailored for Dow stocks, S&P stocks, Tech stocks, and Mid Cap stocks, you can explore various wealth-building strategies.


