Trump announces 50% tariff on copper, effective August 1
VIX Status: 17.1
General (Short-term) Trading Call: Hold (see below for a shift in overall strategy)
Commentary
Unless the market throws in a new surprise, the post-overbought period will deliver a maximum loss of 1.5%. This was the most bullish of the scenarios I outlined two days ago. I also thought it was the least likely of the three probably because it was the least desirable; historically we know the post-overbought period is just as likely to deliver a 1-2% maximum loss as it is to deliver a 7-8% maximum loss.
The three days of buying that drove the recovery almost exactly mirrored the previous three days of selling in BOTH price and volume. The net result is a lot of distracting churn and a return to the edge of another overbought period. “VIX and More” puts the sell-off (from the highs) in good historical context (March 6, 2012):
“Since the beginning of the current bull market – which bottomed at 666.79 exactly three years ago today – I have periodically been posting a table of the most significant pullbacks in the S&P 500 index since that March 2009 bottom. For the record, the current 2.6% decline over four days is barely enough to get it to qualify as one of those 16 pullbacks…
…investors should probably keep in mind that the median pullback during the last three years has lasted 7 trading days and dropped the SPX a total of 5.6%.”
Assuming the pullback from the highs has indeed ended, this bout of selling appears relatively mild and almost insignificant.
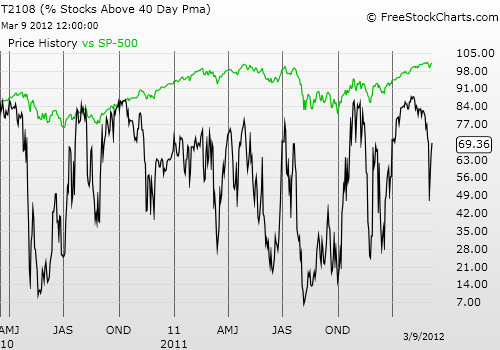
T2108 now equals 69% and barring a surprise twist, I expect T2108 to now embark on either a consolidation period with a slight upward bias or a resumption of the previous steady, grinding rally. The sellers have once again proven they lack conviction. Given the stubbornly low buying volume, I cannot say the buyers are demonstrating strength of will.
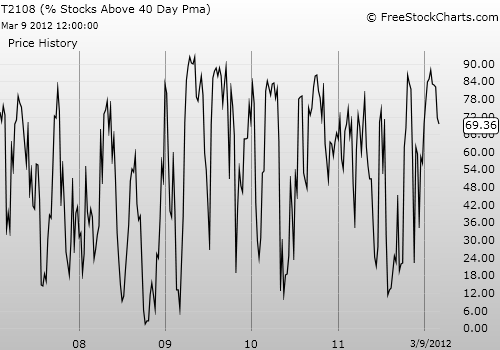
As I have discussed many times, the historical data support my expectation. The previous extended and extreme overbought condition suggests the stock market remains in the midst of a bull market run. Note again that since 1986, no three-year period has had such a concentration of extended and extreme overbought periods like these last three years. In other words, the stock market is demonstrating persistently extreme behavior, and traders and investors must remain alert for the counter-balance to these extremes in bullishness. Granted, these extremes may already represent the counter-balance to the extremes in bearishness between 2008-2009.
I find myself left in an awkward situation for the T2108 portfolio. I prefer to use it as a contrary tool, buying when all hope seems lost and selling (shorting) when all fear has disappeared. I particularly HATE chasing stocks upward. Yet, my expectation going forward compels me to put the T2108 portfolio in trend-following mode.
Going forward, I will be maintaining the current bearish configuration (SDS and VXX shares) as a hedge to this trend-following strategy. I want to keep this component in place in case some black swan swoops in to deliver an extreme counter-punch.
In parallel, I will be aggressively executing swing trades (duration of 1 to 3 days or so) in the indices AND individual stocks, using shares and options. I will particularly focus on fading any and all pops in VXX with put options.
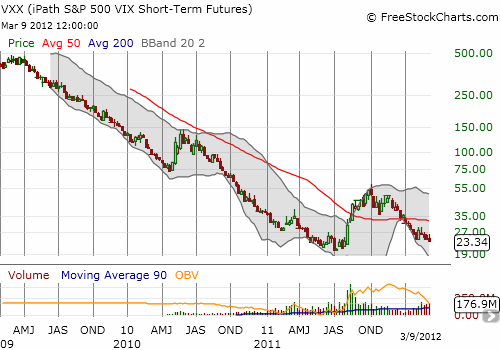
The weekly chart below reminds us that VXX’s ultimate fate is always lower prices; I may drop VXX shares altogether if for some reason I am not able to stay ahead of losses with VXX put options. During the current VXX downtrend, trading these puts have consistently delivered attractive profits for me (but not in the T2108 portfolio unfortunately!). I recommend reading “Volatility ETFs Often Own All VIX Futures” for understanding why the current crop of volatility products perform so poorly over an extended period of time.

By keeping a brief holding period on the bullish trades, I hope to maximize the productivity of my inventory (cash) while the overall market trudges upward. My strategy will be least effective during periods where the S&P 500 punches sharply upward for many days in a row since I will be selling into the first two days or so of such a rally.
I also hope to have a minimal bullish exposure during pullbacks. Over the next several weeks, perhaps months, I expect T2108 to bounce in and out of overbought conditions but NOT to reach oversold conditions. The higher T2108 travels, the smaller my bullish position will get. The biggest trick will be figuring out how to be aggressive but not “too aggressive” as T2108 falls since I want to maintain plenty of cash on hand in case T2108 somehow does manage to stumble its way into oversold conditions.
I will remain watchful for clues that signal the need for another change in strategy. The next big seasonal milestone on my radar is, you guessed it, “sell in May.” My last analysis on “sell in May” proved particularly timely last year. See “Summer’s Positive Gains Can Come With High Risks“.
Charts below are the latest snapshots of T2108 (and the S&P 500)
Refresh browser if the charts are the same as the last T2108 update.

Black line: T2108 (measured on the right); Green line: S&P 500 (for comparative purposes)

Which stock should you buy in your very next trade?
With valuations skyrocketing in 2024, many investors are uneasy putting more money into stocks. Unsure where to invest next? Get access to our proven portfolios and discover high-potential opportunities.
In 2024 alone, ProPicks AI identified 2 stocks that surged over 150%, 4 additional stocks that leaped over 30%, and 3 more that climbed over 25%. That's an impressive track record.
With portfolios tailored for Dow stocks, S&P stocks, Tech stocks, and Mid Cap stocks, you can explore various wealth-building strategies.
