
Mid-cap stocks have been underperforming large-cap stocks for quite some time. Perhaps, this is a reason for the malaise in the broader market over the past year.
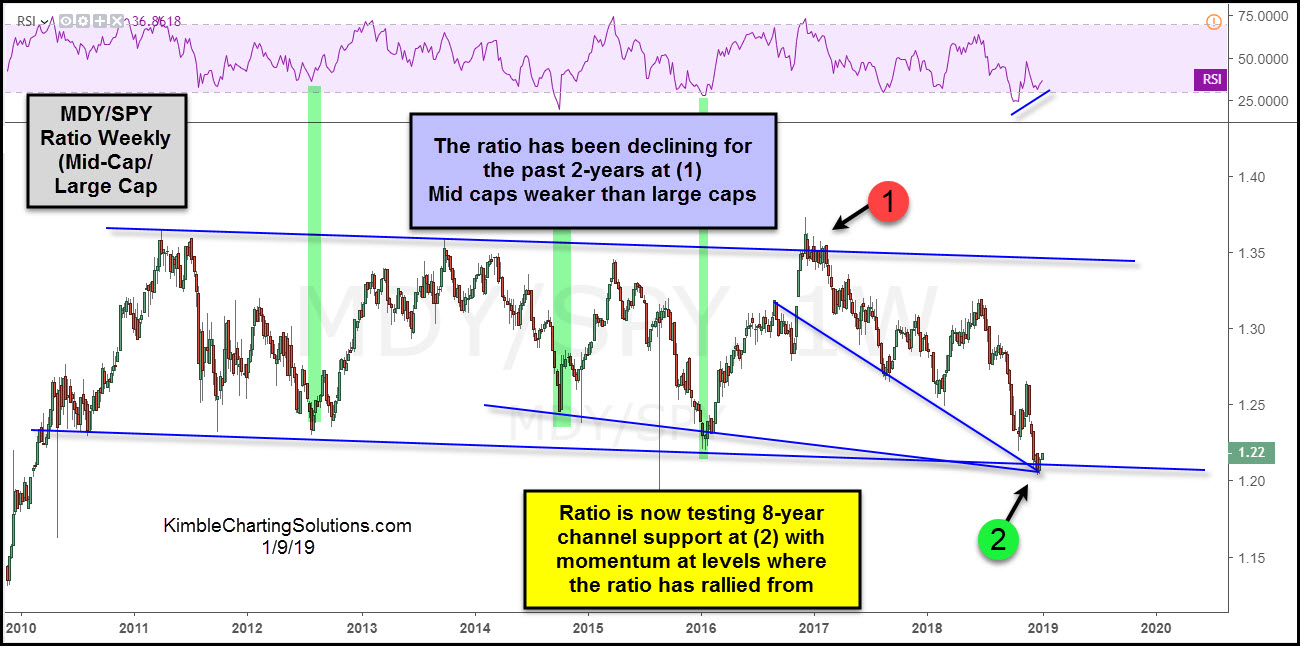
Let’s take a closer look at what’s happening. In the chart below, we look at the performance ratio of mid-cap stocks to large-cap stocks, using the S&P Mid Cap ETF (MDY) and the S&P 500 (SPY (NYSE:SPY)).
As you can see, it’s been trading in a longer-term channel and hit upside resistance in late 2016 / early 2017 at (1). And it has been heading lower ever since.
The decline is currently testing 8-year support (2) with momentum levels oversold and potentially creating a higher low. Mid-caps have rallied from these momentum levels in the past (see green markers).
A setup is in play for Mid-cap stocks to outperform Large-cap stocks. Stay tuned!
Mid-Cap Stocks (MDY) / Large-Cap Stocks (SPY) Ratio Chart
Which stock should you buy in your very next trade?
AI computing powers are changing the stock market. Investing.com's ProPicks AI includes 6 winning stock portfolios chosen by our advanced AI. In 2024 alone, ProPicks AI identified 2 stocks that surged over 150%, 4 additional stocks that leaped over 30%, and 3 more that climbed over 25%. Which stock will be the next to soar?
Unlock ProPicks AI