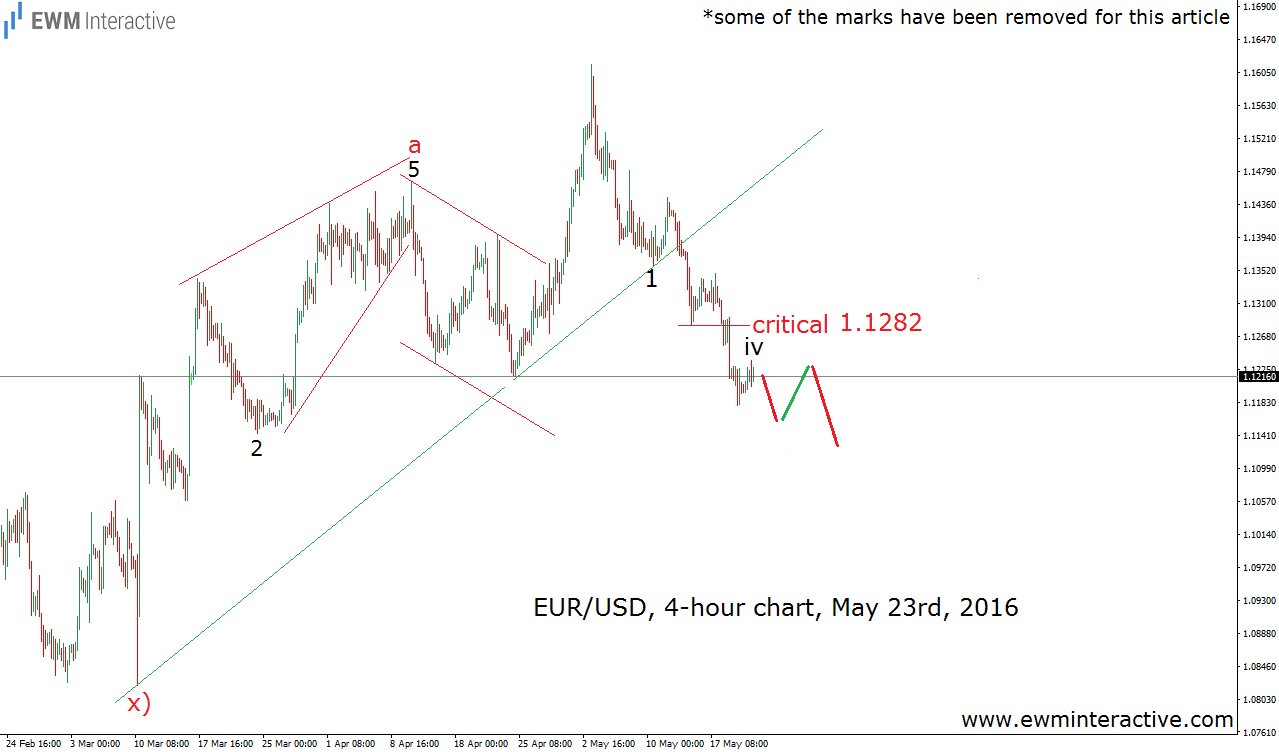
EUR/USD climbed as high as 1.1616 in the beginning of the month, but the bulls could not keep up the positive momentum, allowing the bears to take the rate down to as low as 1.1098 so far. The price action was a little choppy last week, with the pair falling to 1.1129, then climbing to 1.1216, before plunging to a new swing low again. All these ups and downs could make trading quite difficult, so the question is it possible to predict them, and if yes – how? There are probably a number of different ways to do it. We, however, rely on just one – the Elliott Wave Principle. That is the method we applied to the 4-hour chart of EUR/USD given below.
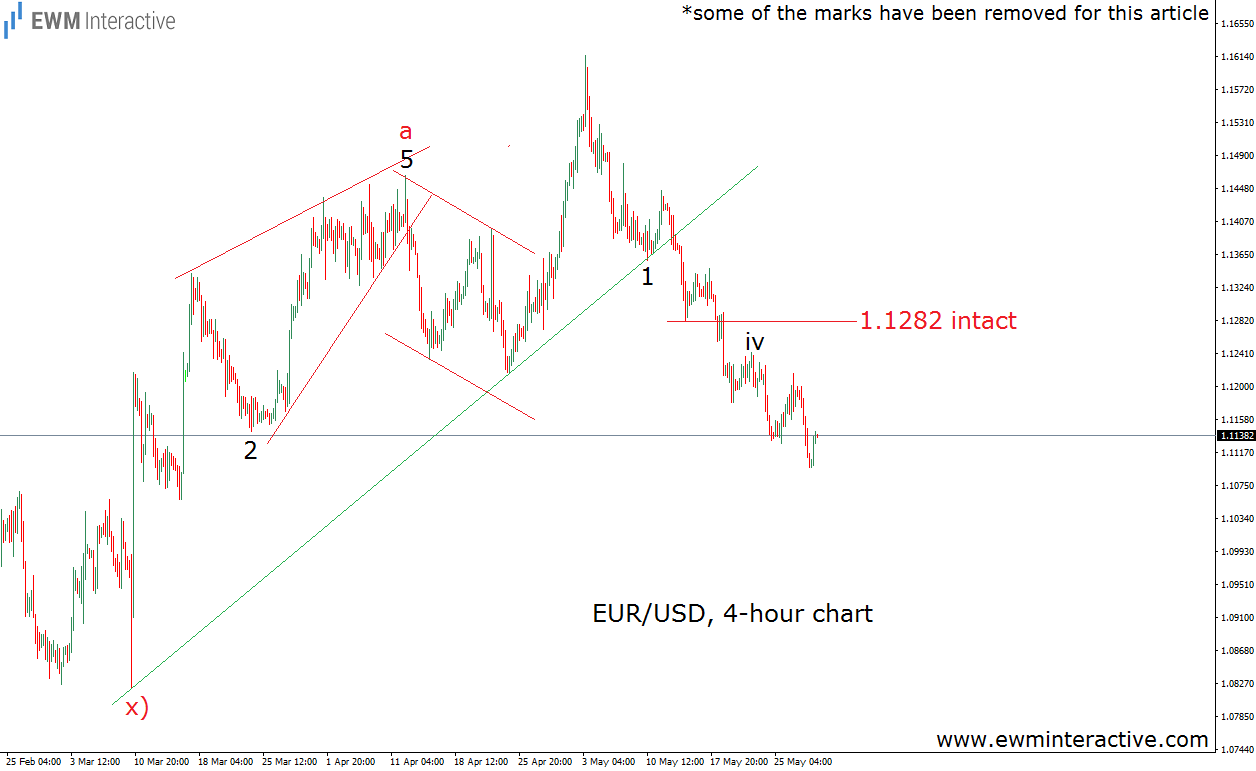
As visible, the Wave principle suggested that as long as 1.1282 holds, lower levels should be expected in EUR/USD. To be more precise, we anticipated two more waves to the south, interrupted by a short-lived recovery in between. The chart above was all we needed to make that forecast, because to us, news and events are nothing more than noise, which could do more harm than good. The week was over on Friday, May 27th, and here is how the updated chart of EUR/USD looks like now.
Thing went quite well. The price action from the top, marked as wave iv, looks almost exactly as the forecast suggested it should. In addition, the critical level at 1.1282 was never touched, so all we had to do is wait for the situation to develop according to plan. What more could a trader ask for?
