Asia stocks mixed; Australia gains on soft CPI, Japan steady before BOJ
Trading on Tuesday did not make changes to the technical picture. The continued strengthening of the us dollar led to the formation of a number of signals on the time frames H1 and H4, indicating today the possibility of local corrective movements. At the same time, the main question of the current week, which was mentioned in yesterday's overview, remains valid: will the possible update of annual minimum values lead to the formation of a convergence between the minima and the corresponding values of technical analysis indicators on the daily time frame? In the case of a positive response, it will be possible to predict with confidence the completion of the medium-term period of growth in the market value of the US dollar and the market reversal. Otherwise, the negative dynamics of the EUR/USD and GBP/USD currency pair quotes will continue.
A lot of important statistics are coming out today. The morning is opened with a meeting of the Bank of Japan. As expected, the Japanese regulator left the rate at the same level. Comments from representatives of the bank did not bring surprises, which may lead to a local decline in the USD/JPY pair quotes, as indicated by the formation of a divergence between price peaks and MACD values.
In the middle of the day are published the important statistics on consumer inflation in the Eurozone. A significant weakening of the European currency in recent years led to the quotes of the EUR/USD pair close to the minimum values of the current year, observed in mid-August. Inflation indicators, in the case of strong statistics, can stop the drop-in prices, otherwise the pair has all the chances to update the annual minimums.
A similar pattern is observed for the pair GBP/USD. The British pound is under strong pressure from sellers, which is a consequence not only of the general strengthening of the dollar in the world currency markets, but also the unresolved problem of Brexit. However, tomorrow's meeting of the Bank of England makes the players to take a waiting position, which should stabilize the situation.
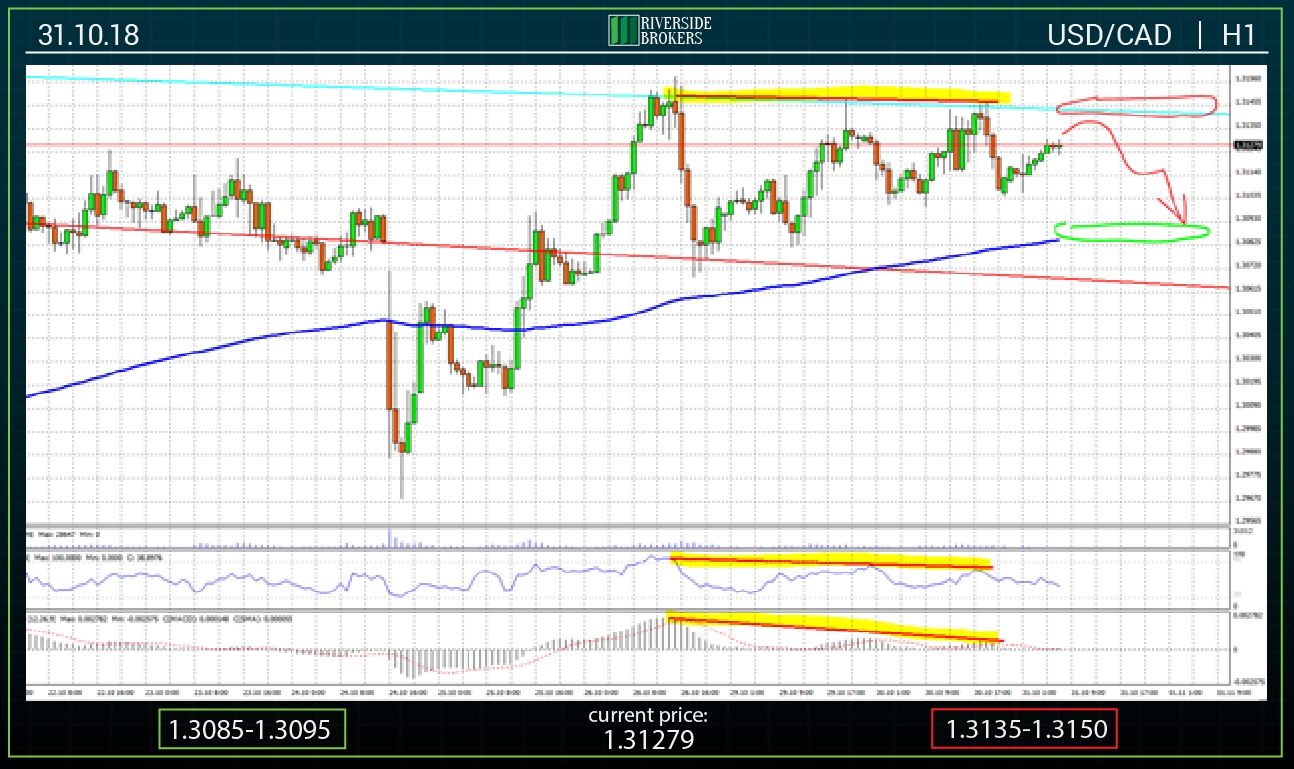
In the afternoon, there will be a report on the US labor market from ADP (NASDAQ:ADP). These statistics precede the publication on Friday of Non-Farm Payrolls. In addition, data on Canadian GDP for August will be released, according to the actual results of which the USD/CAD pair will be answered on the question: will the quotes be able to break through the long-term resistance in the area of 1.3135-1.3150? The technical picture gives a negative answer.
Thus, today’s day is replete with a large amount of important information. The trading sessions of the current week are decisive for the further dynamics of the international currency market in the coming months before the New Year holidays.
EUR/USD
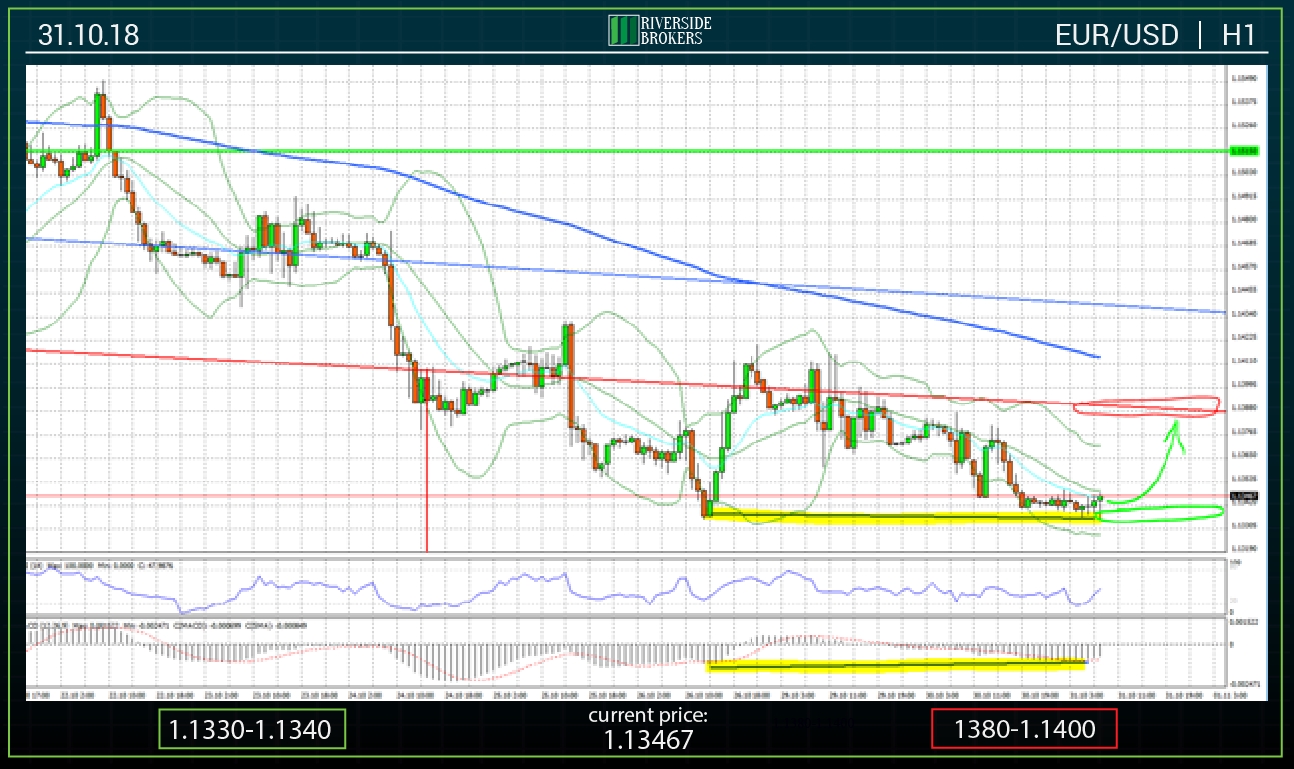
Today morning, the EUR / USD quotes stabilized around 1.1330-1.1340. Thus, as a result of the negative dynamics observed on Tuesday, prices again approached the area of the minimum values of Friday. It is worth noting that the decline in quotations in the last few days led the pair to the lows of the current year, observed in mid-August. The important value of trading in the remaining days of the current week is the probability of testing the specified area of the lows and the formation of technical signals on the daily time frame. As a result, it will be possible to predict the further dynamics of the pair in the next weeks. That about was written in the Monday’s overview.
Today, in the first half of a day, a slight upward correction is expected. This assumption is based on the presence of convergence on the H1 time frame (highlighted on the chart with a yellow marker) between the minima and the values of the MACD indicator. In the middle of the day, statistics on consumer inflation are published by results of October. Players' expectations are at around 2.1% (y/y). In case of strong values of the indicator, the growth impulse will receive support. Otherwise, the quotes may return to their minimum values.
Zones of support and resistance today are in areas 1.1330-1.1340 and 1.1380-1.1400, respectively.
GBP/USD
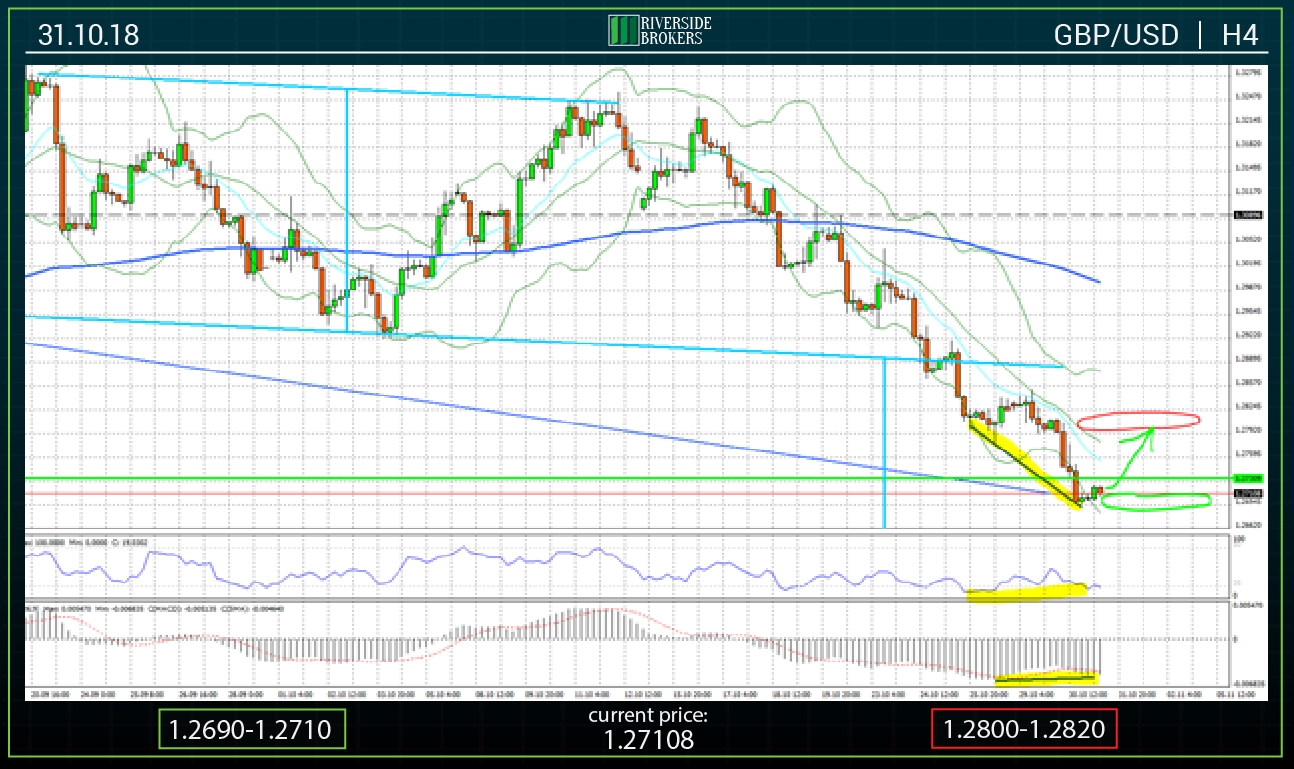
By the morning of today, the GBP/USD pair quotes fell into the area just above the 1.2700 mark. At the same time, on the GBP/USD H4 chart, there is a convergence between local price minima and MACD indicator values (highlighted on the chart with a yellow marker). This fact indicates the probability of a corrective price movement in the first half of regular trading and the return of prices to the area of 1.2780-1.2800, observed in the night from Monday to Tuesday. Further dynamics of the pair will depend on the important statistics published today, which will determine the mood of the traders to the US dollar. Important for the British pound is tomorrow's meeting of the Bank of England. If the management of the regulator emphasizes the problems associated with Brexit, the pair can resume the negative dynamics in order to test the area of the minimum values of the current year. According to the results of trading this week, the answer will be received to the question about the probability of a reversal in the market and determining the direction of the pair until the end of this year.
The support zone is located in the area of 1.2690-1.2710 (green oval).
The resistance zone is present in the range of 1.2800-1.2820 (red oval).
USD/JPY
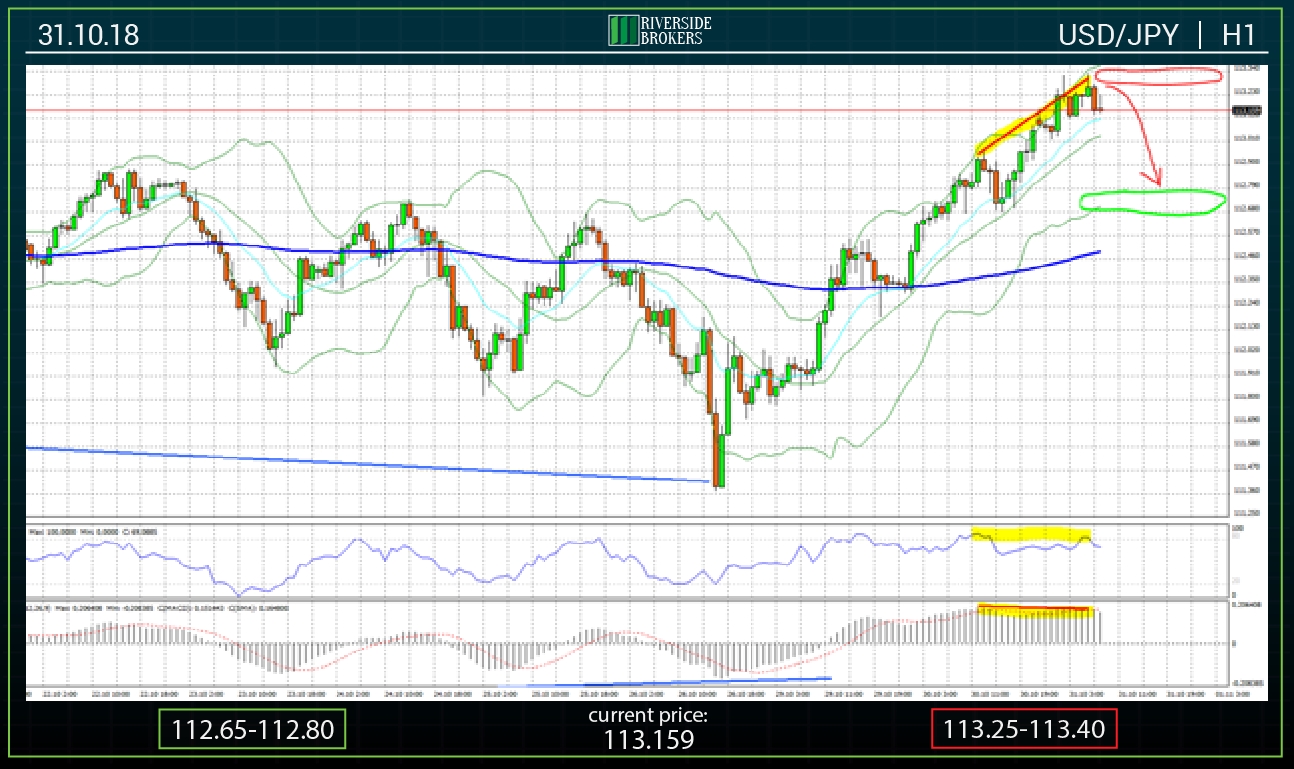
As a result of the positive dynamics, the USD/JPY pair reached the area of 113.20-113.30. At the same time, the formation of divergence between the highs of prices and the values of the RSI and MACD indicators is recorded on the H1 time frame. This fact indicates the probability of today's local price decline to the support area 112.65-112.80. At the same time, it is worth bearing in mind that important statistics published today may have an impact on the dynamics of the pair, which can change the general mood of the players on the further strengthening of the US dollar in world currency markets.
The support zone is the range 112.65-112.80 (green oval).
The resistance zone is located in the area of 113.25-113.40 (red oval).
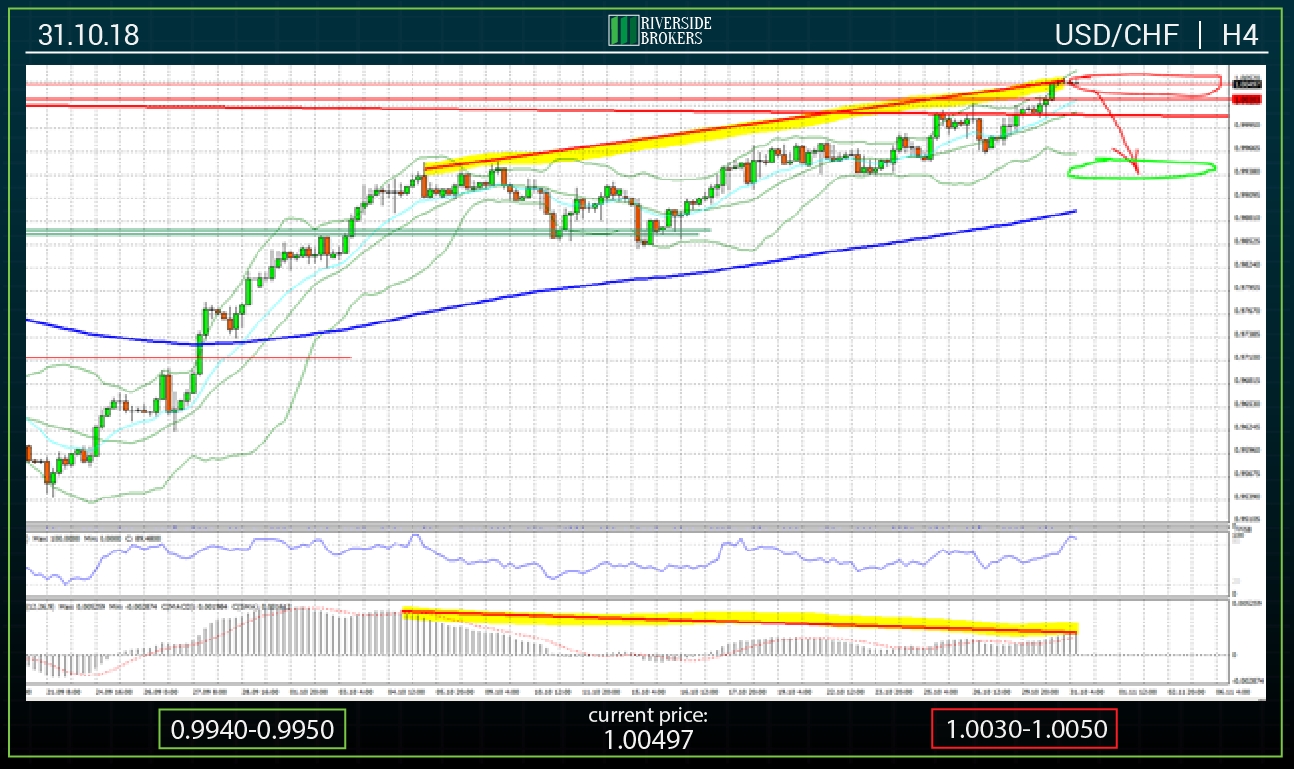
The situation in USD/CHF is unchanged. According to the results of yesterday's trading session the quotations have stabilized in the area above the 1.0000. At the same time, the technical picture still indicates the probability of a market reversal and a decline in quotations. In favor of this scenario, there is a persistence of divergence between local maxima of prices and the values of the MACD indicator. As noted in yesterday’s overview, the situation should be resolved soon.
Support and resistance zones are located in areas 0.9940-0.9950 (green oval) and 1.0030-1.0050 (red oval), respectively.
USD/CAD
During the last few trading sessions, the USD/CAD quotes periodically test for strength the line of multi-year resistance passing through the 1.3150 mark. On the attached chart, USD/CAD H1, there is a divergence between the maximum prices and the corresponding values of the RSI and MACD indicators, which allows us to suggest the probability of a reversal of the dynamics and a decline in quotations. It is worth noting that data on Canada's GDP in August may have a significant impact on the course of trading in this pair.
The support zone is in the range 1.3085-1.3095 (green oval).
Resistance is still located at 1.3135-1.3150 (red oval).
GOLD
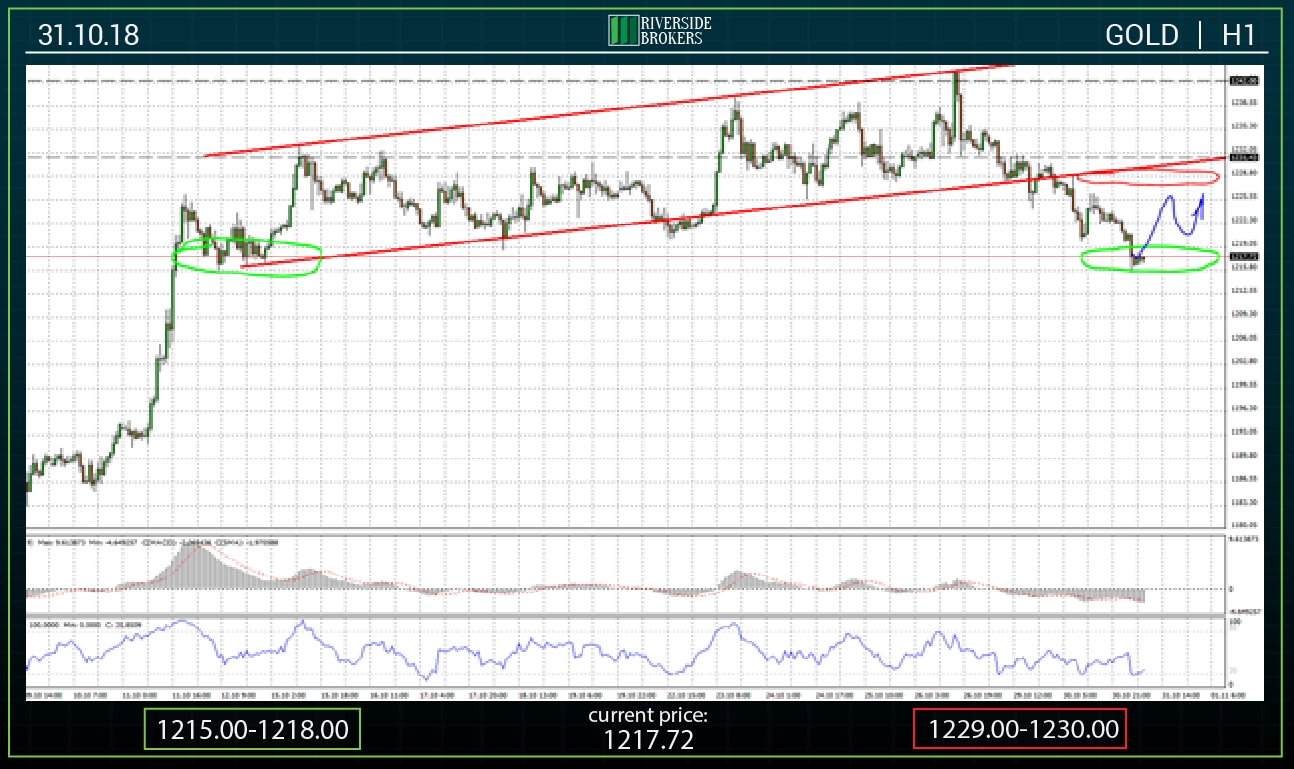
Yesterday and this morning, gold prices continued to decline. On Wednesday morning, prices are around 1215.00-1216.00. It is worth noting that in this range were the minimum prices in the period of October 12-15. On the attached graph, this area is marked with a green oval. Based on this, we can assume the presence in the area of customer support. Today, the support area is located in the same range. In case of its breakout, prices may fall to 1200.00-1210.00, which was the area of maximum prices in the period from mid-August to 11 October, when a rapid increase in quotations was recorded.
Today, it is predicted that the quotes of gold will be in the range bounded below by the indicated support zone. From above, prices are limited to the lower boundary of the medium-term channel in the area of 1229.00-1230.00.
Thus, the support zone is located in the area of 1215.00-1218.00 (green oval).
Resistance is the range 1229.00-1230.00 (red oval)
Which stock should you buy in your very next trade?
With valuations skyrocketing in 2024, many investors are uneasy putting more money into stocks. Unsure where to invest next? Get access to our proven portfolios and discover high-potential opportunities.
In 2024 alone, ProPicks AI identified 2 stocks that surged over 150%, 4 additional stocks that leaped over 30%, and 3 more that climbed over 25%. That's an impressive track record.
With portfolios tailored for Dow stocks, S&P stocks, Tech stocks, and Mid Cap stocks, you can explore various wealth-building strategies.
