The U.S. dollar posted a rebound on Tuesday as stocks were lifted by higher than expected figures from the conference board's consumer confidence which rose to a 16-year high and the Richmond Fed manufacturing index which touched a 7-year high. The data reversed the losses from Monday and was seen strengthening the U.S. dollar across the board.
The dollar also found support from the FOMC member and vice-chairman Stanley Fischer who told in an interview to CNBC that two more rate hikes seem to be "about right."
Looking ahead, the markets will be shifting focus to the UK where the Prime Minister Theresa May is expected to formally invoke Article 50 today. The British pound has been trading weaker since yesterday and could be seen coming under pressure ahead of the announcement.
Elsewhere, the economic calendar continues to remain light with the U.S. pending home sales data expected to show a 2.3% increase.
EUR/USD intra-day analysis

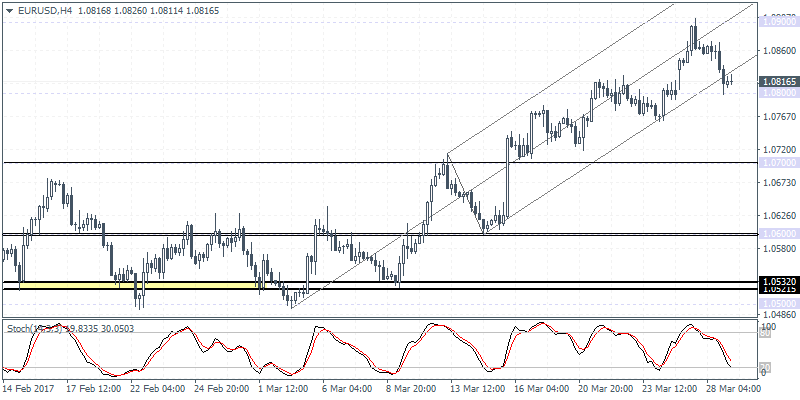
EUR/USD (1.0816):EUR/USD gave up the gains from Monday as price action turned bearish briefly testing 1.0800 support. We can expect to see further continuation to the downside, although the technical support at 1.0765 - 1.0800 is likely to stall the declines in the near term.
There is a possibility that EUR/USD could bounce higher on the day with the potential test 1.0863 - 1.8500 where resistance could be established. This would also mark a lower high in price and could signal a near-term decline towards 1.0700. The 4-hour Stochastics is also currently nearing the oversold level indicating a short term retracement in prices.
USD/JPY intra-dayanalysis

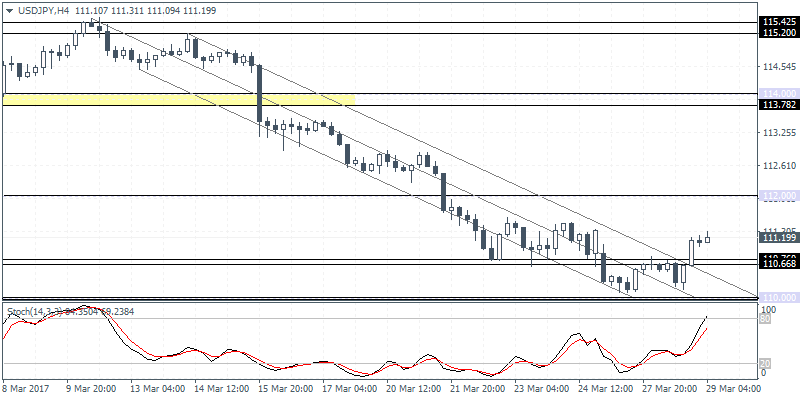
USD/JPY (111.19):USD/JPY closed bullish yesterday after prices fell to a 4-month low at 110.11 on Monday. The rebound could be expected although a near term retracement to 110.75 - 110.65 could be expected. This could also form a higher low in prices and could signal a near-term rally towards the initial resistance level established at 112.00.
A break out above 112.00 will trigger further gains towards 113.80 resistance. To the downside, failure to hold the gains near 110.65 could signal a move towards 110.00 which was not tested earlier on Monday.
GBP/USD intra-day analysis

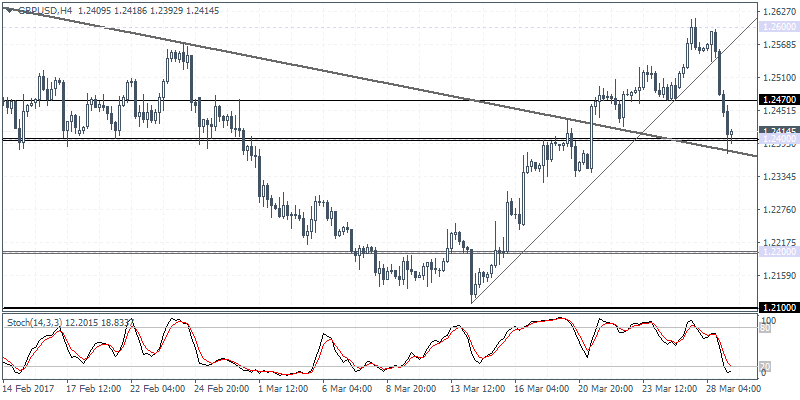
GBP/USD (1.2414):The British pound posted steady declines since Tuesday after Monday's rally saw prices testing 1.2600 resistance level. The subsequent lower high near 1.2600 led to a strong pace of declines that saw GBP/USD breaking past the support level at 1.2470 and currently bouncing off 1.2400 support. In the near term, GBP/USD could remain range bound within 1.2470 and 1.2400 with a breakout from these levels likely to establish further gains or declines in the trend.
To the upside, above 1.2470, expect further gains to test 1.2600 followed by 1.2700 which will see prices testing February 2nd highs. To the downside, below 1.2400 expect GBP/USD to slide towards 1.2200 lower support.
