A funny thing happened on the way that bond bear market. But first the promised charts:
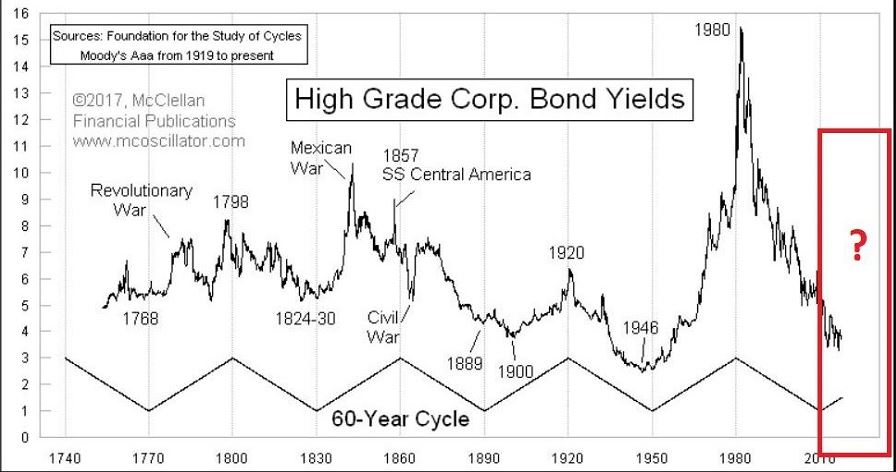
*Figure 1 strongly suggests that the next major move in bond yields is higher (as yields tend to move in roughly 30-year up and 30-year down waves).

Figure 1 – 60-year bond yield cycle (Courtesy: www.mcoscillator.com)
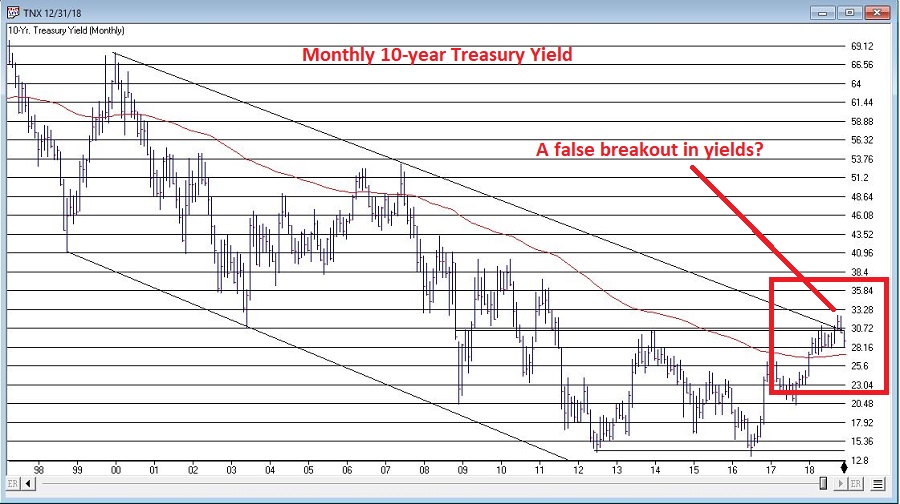
*Figure 2 displays the 10-year treasury note yield – with a long, long downtrend followed by an advance to a potential “fake out breakout” to the upside. More to follow.

Figure 2 – 10-year treasury yields (x10); ticker TNX (Courtesy AIQ TradingExpert)
Now for the recap:
*The 10-year treasury yield (TNX) topped out in the early 1980’s and declined to a low in July 2012.
*TNX then moved higher for about a year, then drifted lower to its ultimate low around 1.35 three years later in 2016.
*From there rates rose to roughly 3.25% by October 2018. Along the way it took out its 120-month moving average, a horizontal resistance line at about 3.04% and finally a downward sloping trend line in October 2018.
*With “final resistance” pierced many bond market prognosticators assumed that yields were off to the races.
*And then that “funny thing” happened. 10-year yields fell from 3.25% in October to a recent level of roughly 2.90%.
At this point “predicting” where TNX is headed in the short run from here is pure conjecture. There is a chance that rates will not rally anytime soon and that they may even continue to drift back lower. Take your pick. Flip a coin. Whatever. The bottom line is that what you see in Figure 2 is entirely in “the eye of the beholder.”
So let’s circle back to Figure 1. The bottom line is this:
*The odds appear very good that the next 30 years in in bond yield will look a lot different than the last 30 years, when high grade bond yield fell from 15% to roughly 3% (which is OK, because if rates ever go negative and I have to pay the government just to hold my money I am going to be really pissed….but I digress).
*Short-term “traders” can trade long-term bonds to their hearts content. However, “investors” may be wise to avoid long-term bonds. Consider ticker TLT, the iShares 20+ year treasury bond ETF. It presently has a 30-day SEC yield of 3.06% and an “average duration” of 17.42 years. Here is how to understand that:
–Regarding yield, if price remained completely unchanged, and investor would theoretically earn roughly 3.06% in interest over the next 12 months
–Regarding duration, if interest rates rose one full percentage point, ticker TLT would theoretically lose -17.42% in value
Long-term bonds may rally from time to time. However, for long-term investors holding bonds, this is NOT a favorable reward-to-risk tradeoff.
Summary
In the “big picture” we probably are in a long-term bear market for bonds. But it may not look like it for a while. So trade in and out as much as you’d like. But for bond investment purposes I am keeping duration short.
Disclaimer: The data presented herein were obtained from various third-party sources. While I believe the data to be reliable, no representation is made as to, and no responsibility, warranty or liability is accepted for the accuracy or completeness of such information. The information, opinions and ideas expressed herein are for informational and educational purposes only and do not constitute and should not be construed as investment advice, an advertisement or offering of investment advisory services, or an offer to sell or a solicitation to buy any security.
