UBS says this sector remains a high-quality, defensive investment theme
At the end of 2018, the global financial markets were reeling, the S&P 500 briefly fell into official bear market territory, and fear gauges were spiking. Sure enough, the Fed started to panic and backpedal on its previously hawkish tone regarding future rate hikes and quantitative tightening. Around the same time, Treasury Secretary Steven Mnuchin summoned the “Plunge Protection Team” or PPT to help shore up the U.S. financial markets. Since then, the S&P 500 is up over 24% and mainstream investors naively think “everything is great again!”
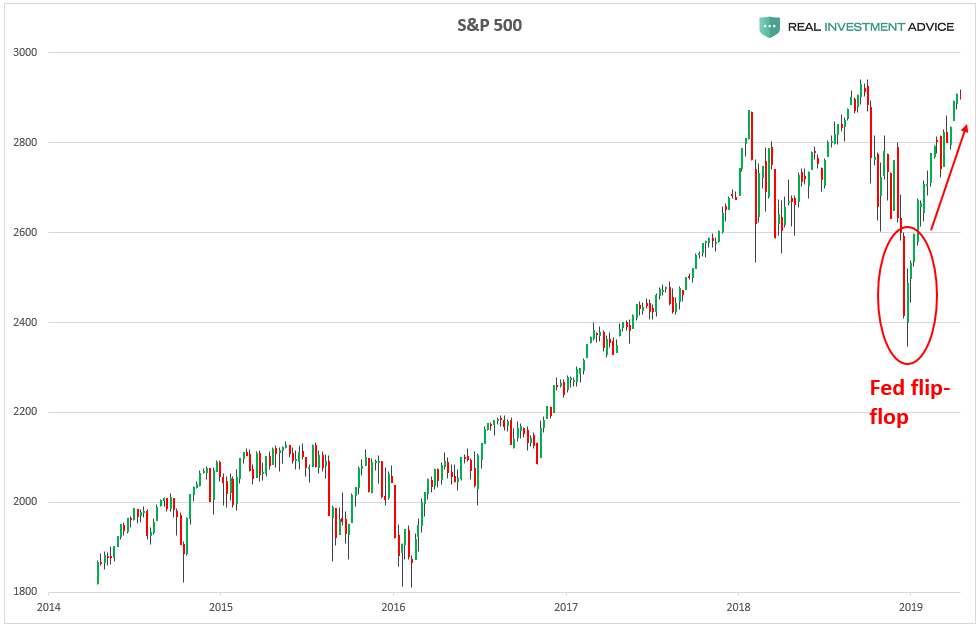
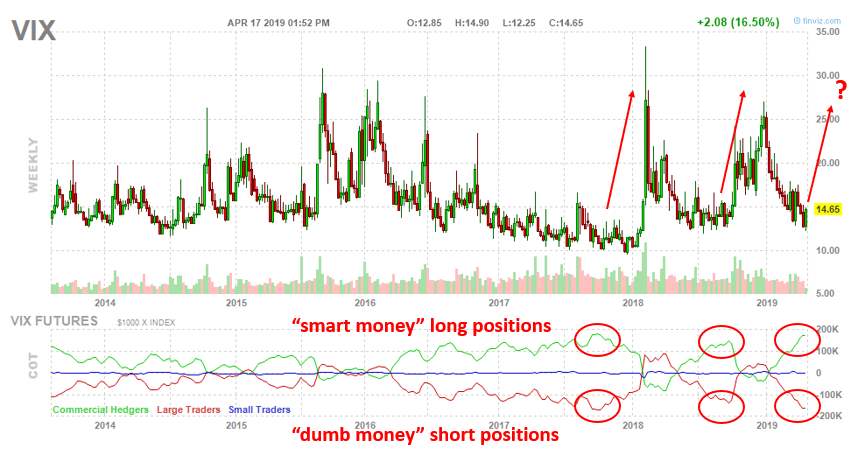
As a result of the Fed’s flip-flop and resulting market surge, investors are very complacent once again (“why worry? the Fed has our backs!”). For example, the Volatility Index or VIX – a popular investor fear gauge – has been below 15 for the past couple months. Unfortunately, that is a reason for concern because the VIX also hit similar low levels before the last two volatility spikes and stock market plunges in early-2018 and late-2018 (volatility spikes when the stock market falls). In addition, the “smart money” or commercial futures hedgers (who tend to be right at major market turning points), are building up another bullish position in VIX futures, just like they did before the last two spikes.
At the same time, the “dumb money,” or large traders (who tend to be wrong at major turning points), have built up a large short position, like they did before the last two spikes.
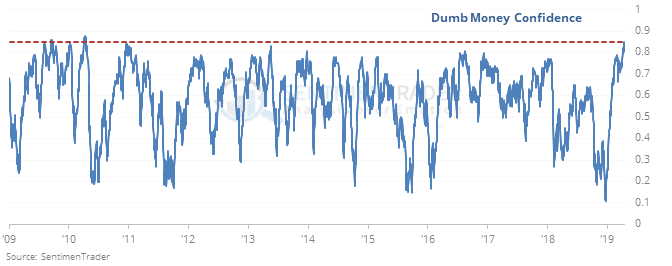
Worrisome investor complacency can also been seen in SentimenTrader’s Dumb Money Confidence index, which shows that the “dumb money” in the stock market are the most confident in a decade:
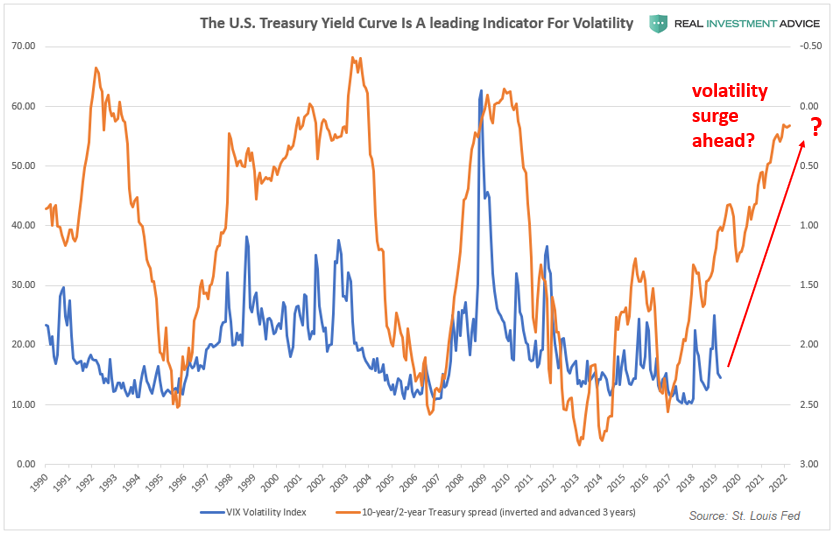
Another indicator that supports the “higher volatility ahead” thesis is the 10-year/2-year Treasury spread. When this spread is inverted, it leads the Volatility Index by approximately three years.
If this historic relationship is still valid, we should prepare for much higher volatility over the next few years. A volatility surge of the magnitude suggested by the 10-year/2-year Treasury spread would likely be the result of a recession and a bursting of the massive asset bubble created by the Fed in the past decade.
As a result of the Fed’s aggressive inflation of the stock market in the past decade, the S&P 500 rose much faster than earnings and is now at 1929-like valuations, which means that a painful correction is inevitable one way or another:
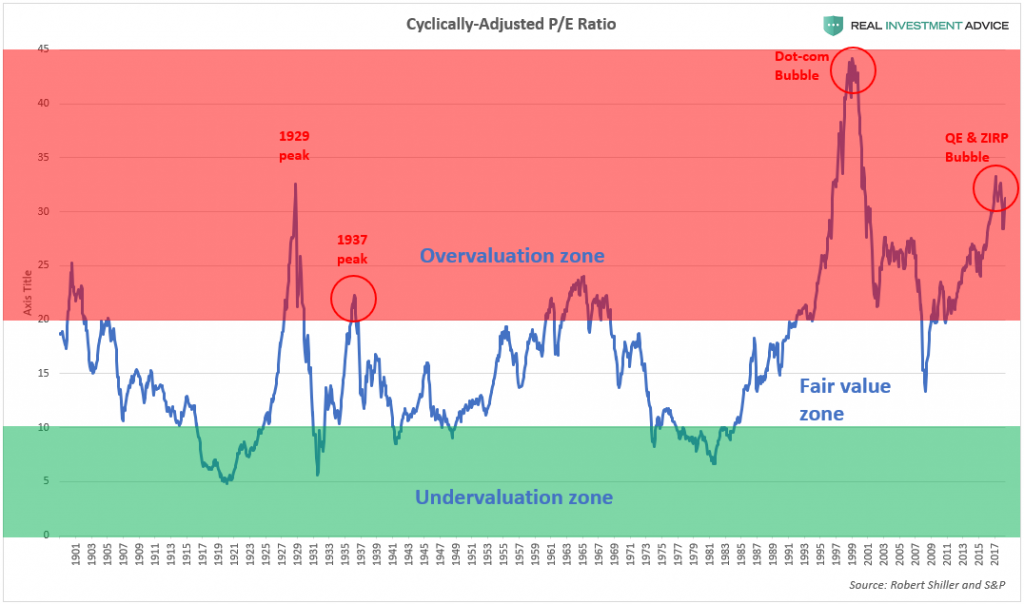
While it’s tough to say for certain that a volatility spike is imminent because we’re in an artificial market that is manipulated by the Fed and other central banks, the warning signs I showed are certainly worth keeping an eye on. Undoubtedly, the conditions necessary for another market rout and volatility spike are already present – the only thing that is holding the market up is faith that the Fed will continue to guide it higher even though economic data continues to deteriorate. At some point, investors will be forced to face reality.
Which stock should you buy in your very next trade?
AI computing powers are changing the stock market. Investing.com's ProPicks AI includes 6 winning stock portfolios chosen by our advanced AI. In 2024 alone, ProPicks AI identified 2 stocks that surged over 150%, 4 additional stocks that leaped over 30%, and 3 more that climbed over 25%. Which stock will be the next to soar?
Unlock ProPicks AI

