AT40 = 41.5% of stocks are trading above their respective 40-day moving averages (DMAs)
AT200 = 59.8% of stocks are trading above their respective 200DMAs
VIX = 11.5 (volatility index)
Short-term Trading Call: neutral
Commentary
Looks like I switched the short-term trading call from bearish to neutral just in time. The follow-through to Monday's setup could not look more bullish.
The S&P 500 (via SPDR S&P 500 (NYSE:SPY)) gained 0.7% and made a new 5-day closing high. While the index is still below its downtrending 20DMA, the move confirmed support at the 50DMA.
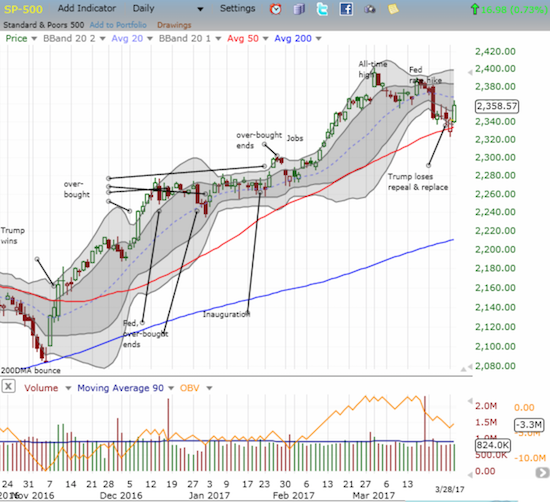
The S&P 500 (SPY) confirmed support at its 50-day moving average (DMA).
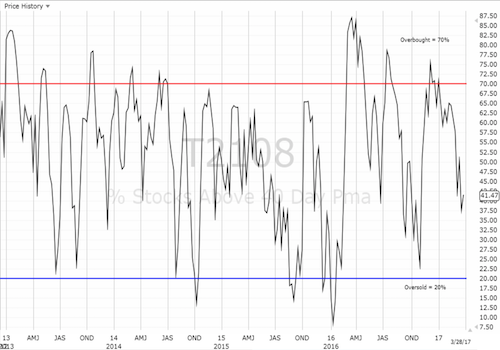
AT40 (T2108), the percentage of stocks trading above their respective 40DMAs, surged to 41.5% and added to the confirmation of bullish sentiment. The volatility index, the VIX, once again added an exclamation point. Monday's vicious fade continued into Tuesday with a 7.8% plunge that closed the VIX in the lower part of the previous range.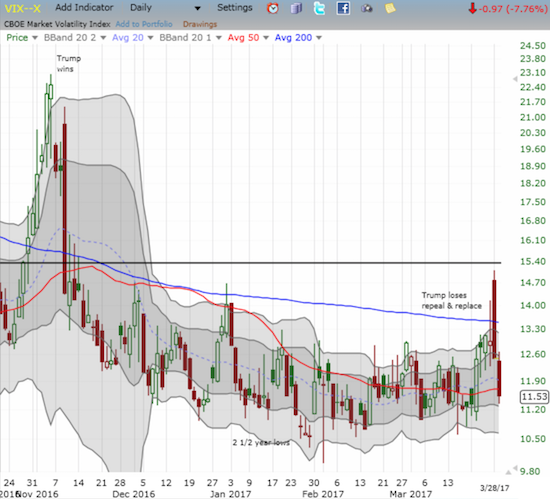
The volatility index completed a full fade from a very brief period of angst.
The currency market delivered its approval to the bullish follow-through in stocks. For example, the Australian dollar (NYSE:FXA) versus the Japanese yen (NYSE:FXY), AUD/JPY, surged off its recent low. While the indicative currency pair still looks like it has topped out, plenty of headroom exists to support an on-going rally.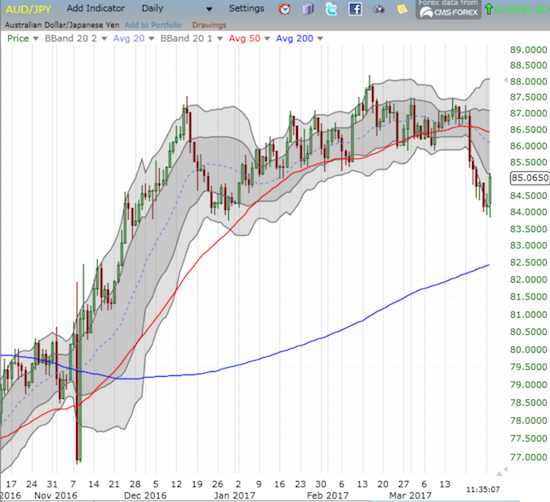
AUD/JPY jumped almost 1% off its recent low in its own show of support for the bulls and buyers.
In the stock market, I like the clarion call coming from Apple (NASDAQ:AAPL). Just last week, I pointed out the warning sign from a bearish engulfing pattern. Tuesday, AAPL invalidated that classic topping pattern by surging a whopping 2.1% to a new all-time high. I chose the WRONG week to place a hold on my weekly trade on AAPL call options!
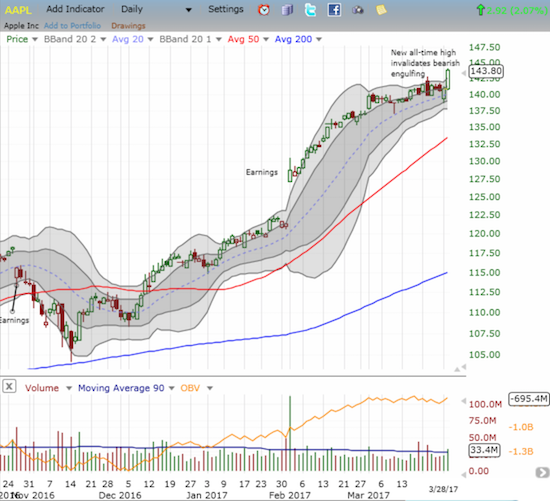
Apple (AAPL) re-established its impressive momentum with a 2.1% jump to another all-time high.
Financials have a long way to go to recapture a market leadership position, but at least the Financial Select Sector SPDR ETF (NYSE:XLF) rallied with a 1.4% gain. Note that XLF stopped cold at the resistance now formed from the February breakout level (the thick black horizontal line in the chart below).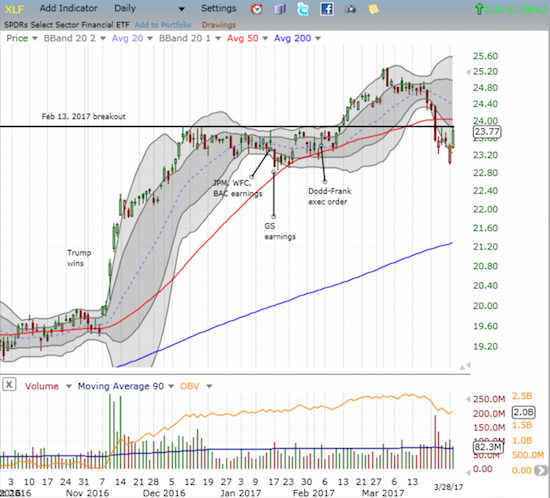
The Financial Select Sector SPDR ETF (XLF) finally woke up but stopped short at resistance.
In previous posts, I failed to note the milestone made by retailers. A week ago, the SPDR S&P Retail (NYSE:XRT) joined oil-related stocks and AT40 in completing a full reversal of its post-election gains. Although retail earnings collectively continue to disappoint, I am now watching XRT closely as it struggles to carve a bottom at this point of potential support. I will consider a close above the downtrending 50DMA indicative of a confirmed bottom.
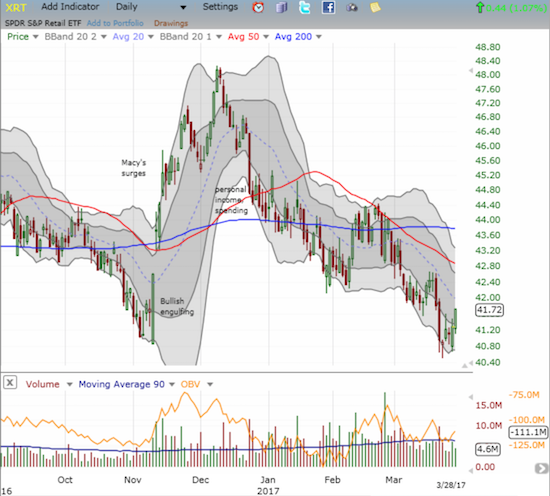
The SPDR S&P Retail ETF (XRT) is trying to carve out a bottom wth all its post-election gains gone to dust, but low trading volume warns me that the enthusiasm is sorely lacking to make this attempt a success.
My on-going monitoring of Snap Inc (NYSE:SNAP) knows no dull moment. SNAP continues to enjoy numerous moves contrary to the general market. Just a day after buyers chased SNAP’s hype men (aka the underwriters) into the stock, stories about new competitive pressure from Facebook (NASDAQ:FB) reversed all those gains and then some. I will be looking to close out my recent short position around $21 and thus going back to a 100% long exposure. I am still assuming SNAP made a near-term bottom on March 17th. I will re-evaluate my strategy if that level gives way sometime soon.
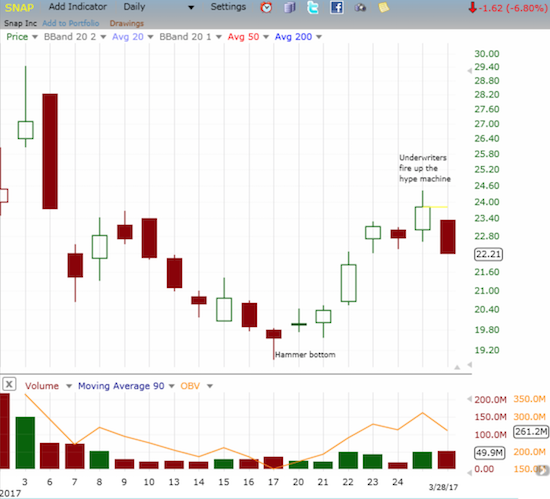
The hype men still have a LOT more work to do as Snap, Inc. (SNAP) gapped down and lost 6.8%.
In other trades, I was able to close out my Goldman Sachs (NYSE:GS) call option at my profit target. Alphabet (NASDAQ:GOOGL) Inc C (NASDAQ:GOOG) traded down early in relative weakness, but I decided not to take profits on my put. Instead, I decided to wait out my hedged trade a little bit longer. GOOG (not shown) did manage to trade above 50DMA resistance, but it fell back to flatline by the close.
My short-term trading call stays at neutral despite the renewed bullishness rampant across the market. I need the S&P 500 close above its downtrending 20DMA before I consider an upgrade.
“Above the 40” uses the percentage of stocks trading above their respective 40-day moving averages (DMAs) to assess the technical health of the stock market and to identify extremes in market sentiment that are likely to reverse. Abbreviated as AT40, Above the 40 is an alternative label for “T2108” which was created by Worden. Learn more about T2108 on my T2108 Resource Page. AT200, or T2107, measures the percentage of stocks trading above their respective 200DMAs.
Active AT40 (T2108) periods: Day #278 over 20%, Day #98 over 30%, Day #1 over 40% (overperiod, ending 5 days under 40%), Day #7 under 50%, Day #19 under 60%, Day #50 under 70%
Daily AT40 (T2108)
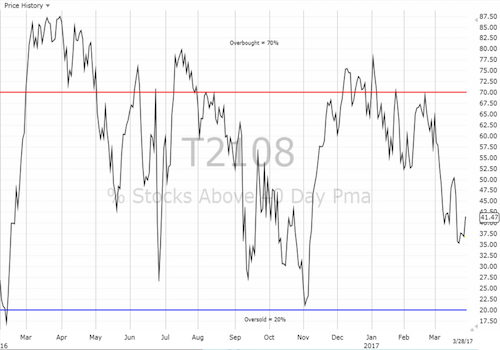
Black line: AT40 (T2108) (% measured on the right)
Red line: Overbought threshold (70%); Blue line: Oversold threshold (20%)
Weekly AT40 (T2108)
Be careful out there!
Full disclosure: net long SNAP, long puts and calls on GOOG
