The last three weeks of November saw a bounce in the bond market, with intermediate and longer bond yields falling after spending most of 2018 rising.
If we look at the US Treasury market (chart 1), we can see the rise in Treasury yields – across the board – from the end of 2017 to early November. A lot of this rise, in our opinion, was to give yields some competition with equity markets, which were certainly frothy early this year, in January, and then in late summer into September. In addition, better growth numbers for the economy, associated with last years’ tax cut, also helped push yields higher. However, core CPI is at 2.1% – approximately where it was at the time of the election in 2016 – though in early November the 10-year US Treasury yield was about 100 basis points higher, at 3.25%, than it was two years earlier. Thus, REAL yields had risen approximately 1% during this time period.

Since early November we have seen 10-year US Treasury yields fall from 3.25% to 3% and 30-year US Treasury yields fall from 3.45% to 3.30%. Shorter yields have also declined. What’s going on? We think a number of factors are changing investors’ expectations about rates
- A slightly softer tone by the Federal Reserve is shifting expectations. While we expect to see the Fed raise the fed funds target in December to 2.25–2.5% percent, the markets certainly seem less married to the idea that we will see three or four rate increases next year.
- Volatility in the equity markets has, we believe, led to some switching into bonds at the margin. Certainly, interest rates that are 80 basis points higher than at the start of the year and even HIGHER on a REAL basis have started to attract interest.
- Previously hot real estate markets in the northeast, California, and other “hot” areas have now cooled. Homes that a year ago were often on the market for 4–5 weeks at most are now on for 4–5 months, and that time is lengthening. Bidding wars are now a thing of the past; and while the housing market may not be fully a buyers’ market, it has clearly transitioned from a sellers’ market. We think the provisions of last year’s tax bill, which dictated that state income taxes and local property taxes will no longer be deductible on federal taxes, are starting to have an effect now that we are less than six months from tax day. Clearly, areas that have high relative property taxes are grappling with what is now a higher after-tax cost of owning a home. Higher mortgage rates this year have also contributed to this cooling,
- The market is reckoning with the fact that the increasing US government deficit will start to have ramifications that were not present over the past half dozen years.


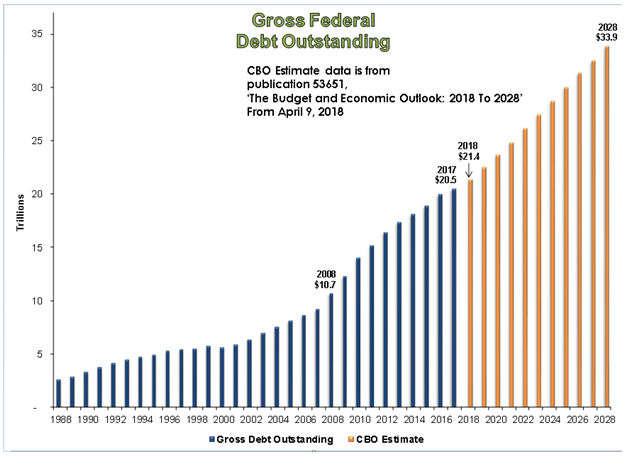
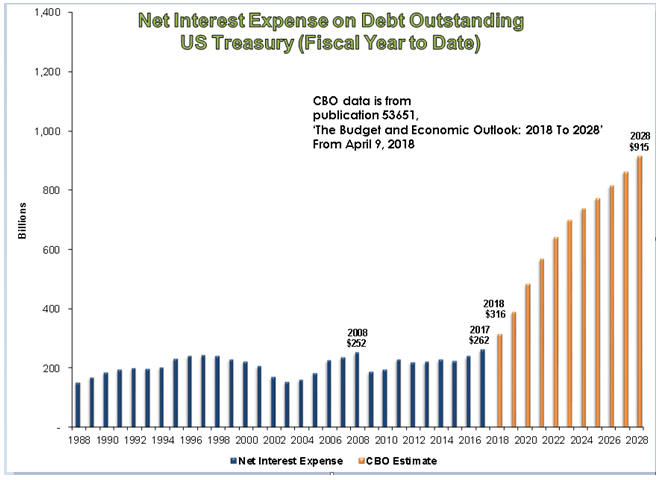
In the charts above we see the growth in outstanding US government debt and Congressional Budget Office projections for future growth. We can see the growth of outstanding federal debt from $10.7 trillion in 2008 to an estimated $21.4 trillion at the end of this year. However, the net interest expense on that government debt barely budged between 2008 (at $252 billion) and 2017 (at $262 billion). But note the large jump this year and going forward. Interest expense on the government debt barely rose in the last decade because of ultra-low interest rates, particularly on shorter-term debt. The jump in interest expense going forward is a function of the higher interest rates in force today

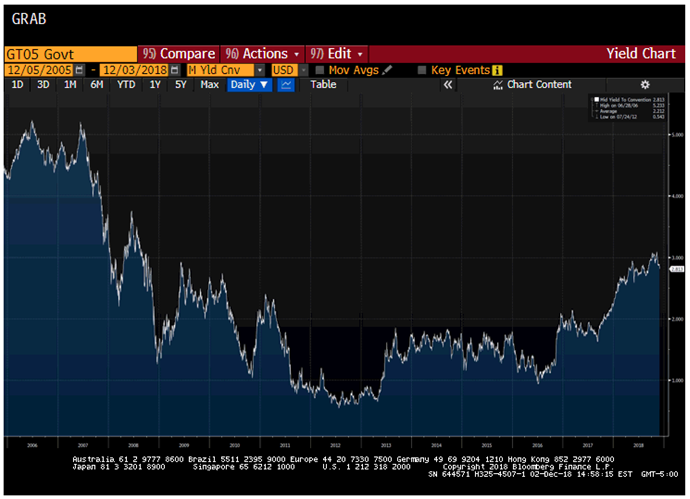
For example, the above graph shows 5-year US Treasury yields going back more than a decade. Bonds that were issued in 2007 at 5% could be replaced when they matured in 2012 at a little more than 0.5%. We are now going the other way. Five-year notes that were issued in the middle of 2013 at around 1% were being replaced this year at almost 3%. This extra interest expense could act as a wet blanket on an economy that is still growing because of lower unemployment and tax cuts.
We think all of this activity has caused investors to ratchet down expectations. We have extended durations within our barbell strategy during the past two months and believe there are forces that should keep intermediate and longer-term interest rates in a trading range, with a bias to going lower. We believe that, with long Treasuries at 3.30%, longer tax-free municipal bond yields in the 4% range still represent excellent value – particularly in high-tax states that will be grappling with the SALT provisions of the tax bill.
We wish all our readers a great holiday season.
