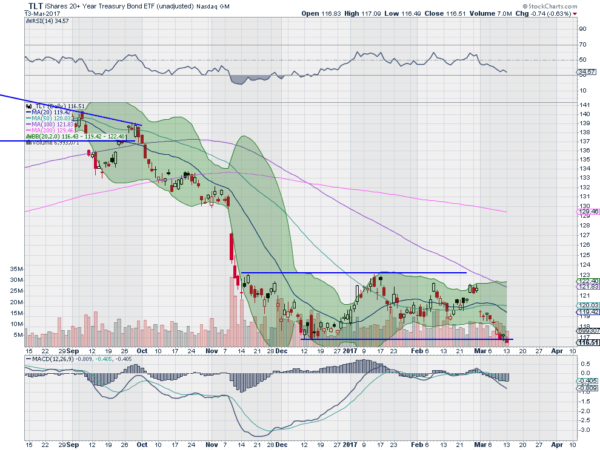
US Treasury Bond prices have defied gravity or 2 years. Yes they have come down from their 2016 peak prices substantially. But wasn’t there a consensus call for a massive reversal of the 30 year bull market in Bond prices with the end of easy monetary policy from the Fed? The flip side measure, interest rates, have not really moved that far. So on the eve of a FOMC Meeting with Fed Funds Futures implying a 95% chance of a rate hike what gives?
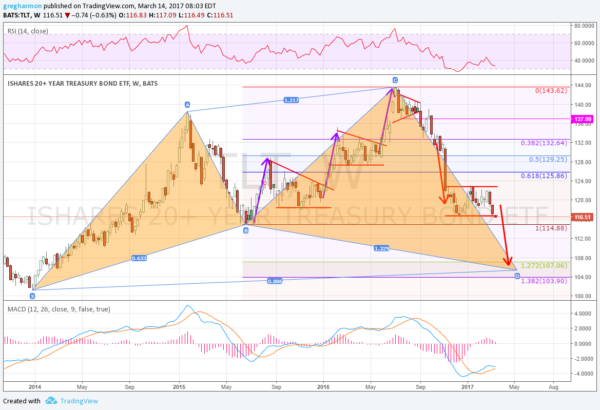
The price action actually does nothing to dissuade the point of lower Bond prices to come. The short term view below on the Bond ETF (iShares 20+ Year Treasury Bond (NASDAQ:TLT)) shows the move off of the 2016 peak into a consolidation zone. What is most notable though is the recent price action, breaking that consolidation zone to the downside Monday. Bond prices mad a new 20 month low. This would suggest that the next leg lower is beginning. How far can they drop? For that we widen out the picture. The longer term weekly chart shows a confluence of events that gives a target range between 107 and 104.

The first indication to review is the Measured Move lower. After completing a 3 Drives Pattern to the upside in July 2016, prices corrected, stalling at the 38.2% retracement of the move up. But rather than calling the drop done, they moved lower out of that brief consolidation into the longer 4 month consolidation range. It is the move out of that range that gives the first downside target to 106.40 on a Measured Move lower.

This is between two key Fibonacci extensions: 127.2% and 138.2%. The first at 107.06 and the second at 103.90 give additional potential downside targets. Finally there is a Shark harmonic pattern that has been playing out since the low at the beginning of 2014. This would give an initial Potential Reversal Zone I (PRZ I) to 105.42.
Four targets between 103.90 and 107.06 that many different types of traders will be focusing on. If those are not low enough there is a full retracement to the 2014 low at 101.17, the round number at 100, a 161.8% retracement of the 2016 move to 97.12 and the PRZ II for the Shark at 96.3. One or all or none of these could play a role. The point is that a lot of traders will be looking for lower prices in Treasuries for a variety of reasons. The easier path looks to be to the downside.
The information in this blog post represents my own opinions and does not contain a recommendation for any particular security or investment. I or my affiliates may hold positions or other interests in securities mentioned in the Blog, please see my Disclaimer page for my full disclaimer.
