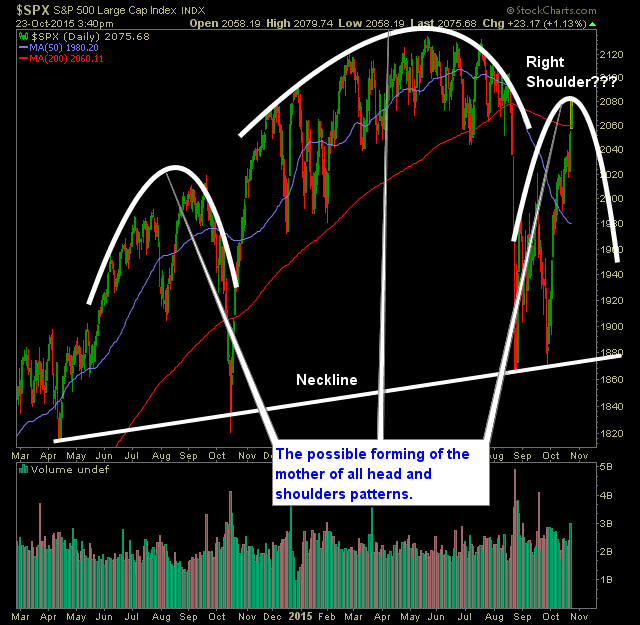
Granted if we just blow through the highs of the year, this pattern means nothing, but if we start to see the selling pick up again and start to make a move back towards those August lows on S&P 500, then this pattern becomes very, very legitimate.
Now, based on on what we are seeing today and yesterday out of the market and the whole month of October, I'm not saying that we should all go sell our long positions. I'm still 30% long/70% cash right now (from 60% long this morning). I'm just saying watch this pattern and whether it develops further.
I can't say with any certainty that it will happen, but it is definitely worth keeping an eye on.
Here's the S&P Head and Shoulders pattern:

Which stock should you buy in your very next trade?
AI computing powers are changing the stock market. Investing.com's ProPicks AI includes 6 winning stock portfolios chosen by our advanced AI. In 2024 alone, ProPicks AI identified 2 stocks that surged over 150%, 4 additional stocks that leaped over 30%, and 3 more that climbed over 25%. Which stock will be the next to soar?
Unlock ProPicks AI