Get 40% Off
⚠ Earnings Alert! Which stocks are poised to surge?
See the stocks on our ProPicks radar. These strategies gained 19.7% year-to-date.
Unlock full list

The Mother Of All Breakouts Remains In Play

Published 10/23/2017, 05:49 PM
Updated 07/09/2023, 06:31 AM

Short-Term View

The NYSE Composite stock index traded near the bottom of the orange box shown below in 2013 and 2016. The index visited the top of the box in 2014, 2015 and again in late 2016 before breaking out. A successful retest of the breakout occurred earlier in 2017.
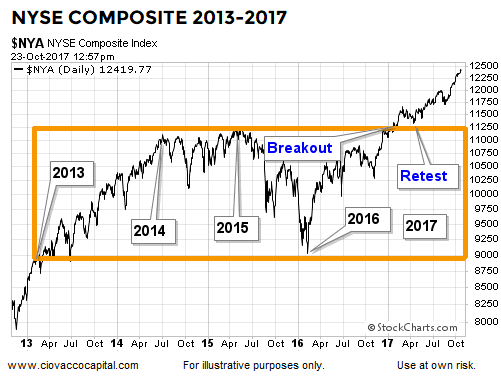
NYSE Composite 2013-2017

Fractals Are Key

Since markets move in fractals, we can apply the same principles to patterns that form on short-term charts to those that appear on long-term charts, even very long-term charts. From stockcharts.com:

Rectangles represent a trading range that pits the bulls against the bears. As the price nears support, buyers step in and push the price higher. As the price nears resistance, bears take over and force the price lower. One group (bulls or bears) will exhaust itself and a winner will emerge when there is a breakout. Only until the price breaks above resistance or below support will it be clear which group has won the battle.

Did The 1987 Crash Come Out Of Left Field?

As the years have gone by, many have come to believe the crash that occurred on Black Monday October 19, 1987 was a true we-had-no-warning-at-all black swan. This week’s video looks at the facts that were in place the Friday before Black Monday, allowing us to better understand the odds of something similar happening in 2017.

The Very Long-Term View

When we view the NYSE Composite Stock Index from 60,000 feet, we see a long-term period of indecisiveness that occurred between 1966 and 1982. After a successful break above resistance and a successful retest, stocks rallied for a very long period of time. A similar period of long-term indecisiveness took place between 1996 and late 2016. As of this writing, the bullish breakout is still in place.
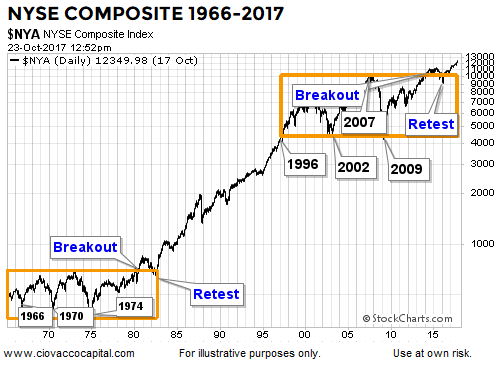
NYSE Composite 1966-2017

Market history tells us the longer a market goes sideways, the bigger the move we can expect to get once a bullish breakout or bearish breakdown occurs. In the present day, stocks moved inside the upper orange box for 21 years. Since first covering the mother of all breakouts on January 27, 2017, stocks have followed the bullish script.

Latest comments

Good analysis is proven over time. Accurate forecast since Nov 2016 ..
The bigger the consolidation the bigger the breakout, yeah.. what he's not telling you is breakouts retest their breakout point all the time, which means you could easily lose 10% or more. Wish he was more balanced
kurt: you're alot smarter than me for certain. i've lost 10% and more in equities over the years. but, i held good quality dividend paying equities and well located real estate and have done very well. you're an exception in that all your trades are timed perfectly, and you only hold when your equities are up. good for you, and i'm impressed.
chris: gotta give this a thought. am doing ok since november 6, but what your pointing too could be huge upswing. that is not something i would want to say you pointed out and i missed. right now i'm thinking. finally a column with some backbone and taking a position.
Risk Disclosure: Trading in financial instruments and/or cryptocurrencies involves high risks including the risk of losing some, or all, of your investment amount, and may not be suitable for all investors. Prices of cryptocurrencies are extremely volatile and may be affected by external factors such as financial, regulatory or political events. Trading on margin increases the financial risks.
Before deciding to trade in financial instrument or cryptocurrencies you should be fully informed of the risks and costs associated with trading the financial markets, carefully consider your investment objectives, level of experience, and risk appetite, and seek professional advice where needed.
Fusion Media would like to remind you that the data contained in this website is not necessarily real-time nor accurate. The data and prices on the website are not necessarily provided by any market or exchange, but may be provided by market makers, and so prices may not be accurate and may differ from the actual price at any given market, meaning prices are indicative and not appropriate for trading purposes. Fusion Media and any provider of the data contained in this website will not accept liability for any loss or damage as a result of your trading, or your reliance on the information contained within this website.
It is prohibited to use, store, reproduce, display, modify, transmit or distribute the data contained in this website without the explicit prior written permission of Fusion Media and/or the data provider. All intellectual property rights are reserved by the providers and/or the exchange providing the data contained in this website.
Fusion Media may be compensated by the advertisers that appear on the website, based on your interaction with the advertisements or advertisers.
© 2007-2024 - Fusion Media Limited. All Rights Reserved.