Trump announces trade deal with EU following months of negotiations
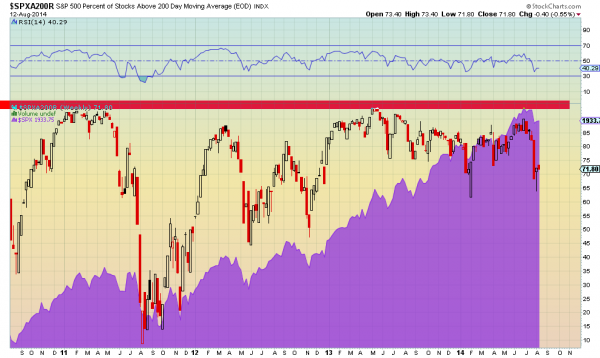
One of the first rules you learn in technical analysis is that, in general, a stock is bullish if it is above the 200 day Simple Moving Average (SMA). This makes sense as it means that over the last 200 days the trend is generally higher. But the 200 day SMA offers so much more information. Below is a chart of the percentage of stocks in the S&P 500 that are above their 200 day SMA. As a backdrop the purple area is the S&P 500.

Several things jump out of this chart. First, the percentage tends to top out between 90 and 95%. That makes sense as the closer to 100% it gets the harder it is for the percentage to continue higher. Next, the percentage has had increasingly low points when it has pulled back.
This tells the story of how strong the bull market is and has been. As more stocks are getting over their 200 day SMA they are staying there. Third, the percentage of stocks over their 200 day SMA can stay high for a long period of time. Over the last 18 months this percentage has only fallen below 75% three brief times. First in early February, then April and finally now. Each of the first two of those dips marked a low in the S&P 500 and a point to move higher. This brings up the last point and maybe the most important. Each spike down in the percentage of stocks over their 200 day SMA since the S&P 500 bottom in 2009 has been a buy signal when it starts to reverse higher. There are at least 12 instances on this slice of the chart alone.
With the Hammer Candlestick print last week there could be another signal in this making this week or next. Do you have your buy list ready?
Disclosure: The information in this blog post represents my own opinions and does not contain a recommendation for any particular security or investment. I or my affiliates may hold positions or other interests in securities mentioned in the Blog, please see my Disclaimer page for my full disclaimer.
Which stock should you buy in your very next trade?
AI computing powers are changing the stock market. Investing.com's ProPicks AI includes 6 winning stock portfolios chosen by our advanced AI. In 2024 alone, ProPicks AI identified 2 stocks that surged over 150%, 4 additional stocks that leaped over 30%, and 3 more that climbed over 25%. Which stock will be the next to soar?
Unlock ProPicks AI