
In late 2016, OPEC, along with the Russian’s and other countries, agreed to cut production in order to try and “balance” the supply/demand imbalance that drove oil prices to the low $30’s at the nadir of the oil price crash.
As Brian Noble noted recently:
“In the past couple of weeks, crude oil futures really did a round trip. First, they took a beating. WTI futures fell on May 4th to $45.52 per barrel, coming down from an April peak of $53.40, hitting the lowest point since the deal between OPEC and non-OPEC oil producers was signed last November. Since then, WTI has rallied up above $49 on as confidence grows over an OPEC cut. So is this more noise or a portent of things to come?”
With OPEC meeting soon to discuss the extension of oil production cuts, the question is whether such actions have made any headway in reducing the current imbalances between supply and demand? This is an important consideration if we are going to see sustainably higher prices in “black gold.”
With respect to the oil cuts, the current cut is the 4th by OPEC since the turn of the century. These cuts in production did not last long, generally speaking, but tend to occur at price peaks, rather than price bottoms, as shown below.

Brian hits on this exact point.
“Despite the occasional rally, it’s hard to see that the outlook for oil is encouraging on both fundamental and technical levels. The charts look to be screaming double top for WTI, while the fundamentals seem to be saying Economics 101: too much supply, too little demand. The parallel with 2014 is there if you want to see it.”
Brian is correct. The current levels of supply potentially creates a longer-term issue for prices globally particularly in the face of weaker global demand due to demographics, energy efficiencies, and debt.
Many point to the 2008 commodity crash as THE example as to why oil prices are destined to rise in the near term. The clear issue remains supply as it relates to the price of any commodity. With drilling in the Permian Basin expanding currently, any “cuts” by OPEC have already been offset by increased domestic production. Furthermore, any rise in oil prices towards $55/bbl will likely make the OPEC “cuts” very short-lived.

As noted in the chart above, the difference between 2008 and today is that previously the world was fearful of “running out” of oil versus worries about an “oil glut” today.
The issues of supply versus price becomes clearer if we look further back in history to the last crash in commodity prices which marked an extremely long period of oil price suppression.

As Brian stated, ultimately, it is always about supply and demand.
Reviewing History
In 2008, when prices crashed, the supply of into the marketplace had hit an all time low while global demand was at an all-time high. Remember, the fears of “peak oil” were rampant in news headlines and in the financial markets. Of course, the financial crisis took hold and quickly realigned prices with demand.

Of course, the supply-demand imbalance, combined with suppressed commodity prices in 2008, was the perfect cocktail for a surge in prices as the “fracking miracle” came into focus. The surge of supply alleviated the fears of oil company stability and investors rushed back into energy-related companies to “feast” on the buffet of accelerating profitability into the infinite future.
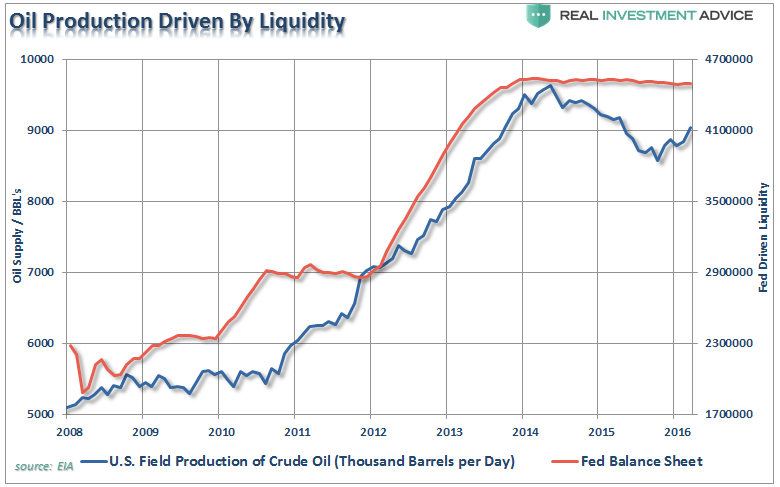
Banks also saw the advantages and were all too ready to lend out money for drilling of speculative wells which was fostered by Federal Reserve liquidity.
As investors gobbled up equity shares, the oil companies chased every potential shale field in the U.S. in hopes to push stock prices higher. It worked…for a while.
Of course, lessons have not been learned as of yet, as banks and investors once again begin to chase speculative “shale” flooding capital into the Eagleford and Permian Basin fields.
The problem currently, and as of yet not fully recognized, is supply-demand imbalance has reverted. With supply now back at levels not seen since the 1970’s, and demand waning due to a debt-cycle driven global economic deflationary cycle, the dynamics for a repeat of the pre-2008 surge in prices is unlikely.

The supply-demand problem is not likely to be resolved over the course of a few months. The current dynamics of the financial markets, global economies and the current level of supply is more akin to that of the early-1980’s. Even is OPEC does continue to reduce output, it is unlikely to rapidly reduce the level of supply currently as shale field production increases.

Since oil production, at any price, is the major part of the revenue streams of energy-related companies, it is unlikely they will dramatically gut their production in the short-term. The important backdrop is extraction from shale continues to become cheaper and more efficient all the time. In turn, this lowers the price point where production becomes profitable increases the supply coming to market.
Then there is the demand side of the equation. For example, my friend Doug Short discussed the issue of a weak economic backdrop.
“There are profound behavioral issues apart from gasoline prices that are influencing miles traveled. These would include the demographics of an aging population in which older people drive less, continuing high unemployment, the ever-growing ability to work remote in the era of the Internet and the use of ever-growing communication technologies as a partial substitute for face-to-face interaction.”

The problem with dropping demand, of course, is the potential for the creation of a “supply glut” that leads to a continued suppression in oil prices.
Couple the weak economic backdrop with the slow and steady growth of renewable/alternative sources of energy as well as technological improvements in energy storage and transfer. Add to those issues that over the next few years EVERY major auto supplier will be continuously rolling out more efficient automobiles including larger offerings of Hybrid and fully electric vehicles.
All this boils down to a long-term, structurally bearish story.
The Bets Are Heavily Bullish
Of course, the economic underpinnings certainly have not stopped Wall Street from jumping on the “bullish bandwagon” to lift oil prices over the last few months. Remember, while we talk about supply/demand as it relates to price in the long-term, it is “speculation” in the options market that sets price in the short-term. The problem, as shown by the net reportable crude oil contracts outstanding, is that “hope for higher oil prices” has kept speculation at levels not seen since the peak of the last crash.

It is also worth noting, with the S&P 500 index hanging near all-time highs, there is a fairly high correlation between the level of crude oil contracts and the financial markets.

The current deviation between the S&P 500 and oil contracts will likely not last long. Either the S&P 500 is due for a more meaningful correction or there is about to be a rapid rise in oil prices. The latter is unlikely.
The supply/demand dynamics currently suggest that oil prices and energy-related investments could find a long-term bottom within the next year or so following the next recession. However, it does not mean those investments will repeat the run witnessed prior to 2008 or 2014. Such is the hope of many investors currently as their “recency bias” tends to overshadow the potential of the underlying fundamental dynamics.
Furthermore, prices of energy stocks have been pushed to very oversold levels in recent weeks, but as noted in past weekend’s newsletter, but remain in a bearish trend.

While investors have chased energy stocks on expectations of minor production cuts from OPEC, little has been done to resolve the fundamental valuation problems which face a majority of these companies, and investors have paid the price as of late. Which is why I had suggested selling energy stocks in November of last year as noted below.

Importantly, note the weekly “sell signal” (vertical dashed red line) at very high levels currently for oil. While there is hope the production cuts will lift oil prices in the short-term, the longer-term technical backdrop suggests a bigger correction may already be in the works.
With respect to investors, the argument can be made that oil prices could remain range-bound for an extremely long period of time as witnessed in the 80’s and 90’s. It is here that lessons learned in the past will once again be re-learned with respect to the dangers of commodities, fundamentals, leverage and greed.
For the Houston economy, there is likely more pain to go through before we reach the end of this current cycle. There are still far too many individuals chasing yields in MLP’s and speculating on bottoms in energy-related companies to suggest a true bottom has been reached.
Just something to consider.