
The Fear Of Missing Out
Over the last couple of weeks, we have been discussing the market’s advance from the lows and why retesting old highs was quite probable. To wit:
“While the bullish bias is definitely behind investors currently, there are concerns relative to the current risk/reward backdrop. As shown in the chart below, the market is not only back to more extreme overbought levels, it is also close to registering a short-term sell signal. With prices now compressed into a very tight range, the risk of a downside break has risen.”
I have updated the chart to show a couple of important points.
As noted, the overbought condition (top panel) is now back to where was the last time we were registering “all-time highs.” Currently, that signal has flattened out to the point where it is dangerously close to crossing lower. Any additional weakness this coming week will likely trigger that sell signal.

Secondly, as noted by StockTrader’s Almanac on Friday (shown above):
“As of the today’s close, the slower moving MACD ‘Sell’ indicator applied to S&P 500 has turned negative. However, DJIA’s MACD ‘Sell’ indicator is still positive. Because DJIA’s indicator remains positive, the criteria to issue our Seasonal MACD Sell Alert has not been satisfied. Currently, a single-day DJIA decline in excess of 1.08% would be needed to turn DJIA’s MACD indicator negative. A single day gain of 0.50% or more by S&P 500 would turn S&P 500’s MACD indicator positive.
Continue to hold long positions associated with DJIA’s and S&P 500’s ‘Best Six Months.’ We will issue our Seasonal MACD Sell signal when corresponding MACD Sell indicators applied to DJIA and S&P 500 both crossover and issue a new sell signal.”
That advice corresponds well with our current positioning as well. We remain long-biased equities currently but are still maintaining some hedges and an overweight position in cash.

- As we discussed two weeks ago, the rally above, and retest of support at 280 sets up a test of all-time highs. That happened last week as expected and we are now watching to see if it can hold.
- SPY (NYSE:SPY) is extremely overbought, so a test and failure at the highs will not be surprising.
- Note the “buy” signal in the lower panel is at a level which has always denoted at least short-term market tops. So currently risk outweighs further reward.
- Short-Term Positioning: Bullish
- Last Week: Hold full weight position
- This Week: Hold, Take profits
- Stop-loss moved up to $280
As my friend Gerry notified me of on Friday, Tom Bowley pointed our similar issues:
“In this chart note thee things:
- The SPX is facing major overhead resistance which at 2905 as of 18-April is just shy of the “all-time high of 2940.91” (the red line) set early last October,
- The current negative divergence between the declining PPO and the rising SPX and
- The relatively high value for the RSI at 67.”

The extremely extended “buy signal,” lower panel, is NOT sustainable. It will revert, and the likelihood is it will revert sooner rather than later.
I am not suggesting the market is about to crash, BUT a retest of the 50-DMA is highly likely. A break of the 50-DMA will quickly test the 200-DMA and below that things become much more concerning.
With earnings season underway, which will kick into high gear next week, there is support for the market short-term. This is only due to the fact that the bar for Q1 earnings has been set so low. The problem for stocks, however, will not be the “beat of earnings” but the “forward guidance.”
With the “trade war” still in progress, a stronger dollar, higher oil prices and rates, there will likely be concerns about forward quarters. Substantial downward revisions to guidance could take some of the “wind out of the market’s sails.”
The chart below is the S&P 500/USD ratio. You will notice that when there are sharp accelerations over a couple of quarters it begins to impact asset prices. One concern of a conclusion of a “trade deal” will be a sharp acceleration in the dollar which will make any “resolution” more like a “sell the news event.”

Lastly, market “complacency” is back to levels which have denoted short-term corrections in the market previously with near record levels of short-volatility positioning.

Also, our RIA PRO Weekly Technical Market Gauge is also pinging very high levels currently as well which also suggests the current rally may be nearing completion for now.

As I wrote last week:
“As such we are maintaining our current equity exposure, with an overweight positioning in cash and fixed income. While this allocation structure is currently providing some performance drag, it is also greatly reducing overall portfolio volatility which we think we will be well rewarded for over the next four to six months.
Simply, the risk/reward setup is no longer as favorable as it was in December.”
Of course, if you listen to the mainstream media you are constantly coached that if you are “aren’t in, you are missing out.”
F.O.M.O. or the “Fear Of Missing Out” is the biggest detractor to long-term portfolio performance over time. It is also one of the biggest emotional inputs into the “buy high/sell low” problem for most investors.
Doug Kass had a great note out on this last week:
“We have a risk of a melt-up, not a meltdown here. Despite where the markets are in equities, we have not seen money being put to work… We have record amounts of money in cash. We still see outflows in retail in equities and in institutions.” – Larry Fink, BlackRock (NYSE:BLK) (appearing on CNBC)
Quick side note: Despite Larry’s bent to pitch his own products, there is NO SUCH THING as CASH ON THE SIDELINES. Every transaction in the market requires both a buyer and a seller with the only differentiating factor being at what PRICE the transaction occurs. Since this must be the case for there to be equilibrium to the markets, there can be no “sidelines.”
Back to Doug:
The CEO of the largest money manager in the world, BlackRock, told Squawk Box that the large retail cash positions coupled with a “shortage of good assets” and the likely continued level of low interest rates could contribute to the fear of missing out and a “melt-up.”
Yes, since investors did sell the December lows, they are now buying the February-March highs. But to Doug’s point, investors are still heavily weighted towards equity.

Fink’s comments, to this observer, were non-rigorous ‘first level thinking’ and failed to detail the very important reasons why interest rates are low and why retail investors (who appear to be surrounded by the comfort of ever popular ETFs (hawked by BlackRock) may have some very good reasons to be wary of equities at this point in time.
The world is clearly upside down. Importantly, global interest rates (with $11 trillion of sovereign debt at negative returns) are delivering a message of disappointing aggregate economic growth. So, low rates, in and of themselves is not, as Fink suggests, a reason to run to equities.
With growing political turmoil, the risks of a policy mistake, the lack of coordination between G-8 powers, untenable levels of debt (in both the private and public sectors), evidence that high frequency global economic statistics and the corporate profit outlook are eroding, and with central banks believing in a smooth monetization of debt – the outlook is not necessarily getting better as the price of financial assets continue to climb.
Indeed, despite Fink’s protestations, investor optimism has actually materially risen – I base this statement on a near three multiple (year to date) expansion in the S&P’s price earnings ratio. Coincident with this has been a reversal, from net short to a near 12 month high in speculative long S&P exposure – as well as an explosion in IPO offerings (many of them experiencing a “profitless prosperity.”)
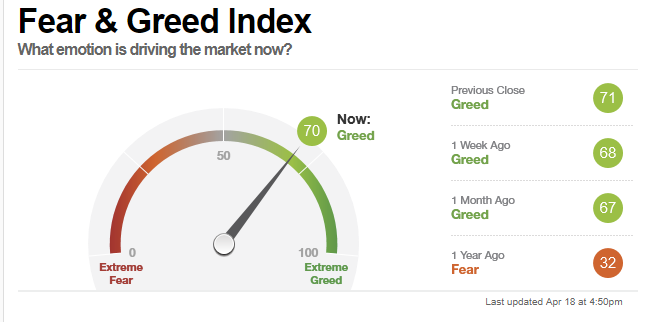
And, oh yes, investors (both institutional and retail) are now greedy as measured by the CNN Fear and Greed Index!
I leave you with final words of wisdom from the legendary Warren Buffett:
“Be fearful when others are greedy.”
Which stock should you buy in your very next trade?
With valuations skyrocketing in 2024, many investors are uneasy putting more money into stocks. Unsure where to invest next? Get access to our proven portfolios and discover high-potential opportunities.
In 2024 alone, ProPicks AI identified 2 stocks that surged over 150%, 4 additional stocks that leaped over 30%, and 3 more that climbed over 25%. That's an impressive track record.
With portfolios tailored for Dow stocks, S&P stocks, Tech stocks, and Mid Cap stocks, you can explore various wealth-building strategies.
