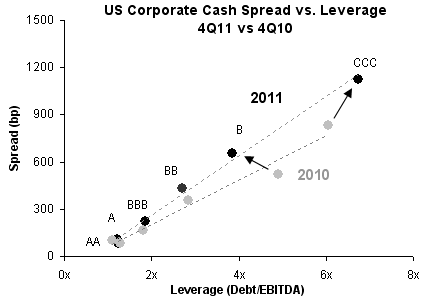
Some recent analysis from Credit Suisse looks at how credit markets are pricing corporate leverage in terms of spread. Intuitively the higher the leverage (risk) of a company, the wider the the spread for that company's bonds. Many credit traders and analysts look for anomalies in this relationship to see if a particular company's bonds may be mispriced. A broader analysis would compare the average spread for a group of companies with the average leverage, to see where they fall on the spread-leverage plot. A deviation from a linear relationship may potentially be an indication that a whole group of companies is too rich or cheap relative to the rest of the market. For example in 2010 the B rated credit spreads were too tight while CCC credits too wide based on the spread-leverage relationship.
But recently the market has become more "rational" about the way that it prices risk. The more leveraged companies (B and CCC) fall into a straight line in the spread-leverage plot (see chart below).

CS: “... spreads are priced surprisingly efficiently with no rating category looking particularly out of line on spread per unit leverage basis. This contrasts to last year’s levels when single-Bs looked rich and CCC cheap relative to other rating groups”
This means that it has become more of a "credit picker's" market. With risk fairly efficiently priced, the game now is to select individual credits that will outperform based on fundamentals.
But recently the market has become more "rational" about the way that it prices risk. The more leveraged companies (B and CCC) fall into a straight line in the spread-leverage plot (see chart below).

CS: “... spreads are priced surprisingly efficiently with no rating category looking particularly out of line on spread per unit leverage basis. This contrasts to last year’s levels when single-Bs looked rich and CCC cheap relative to other rating groups”
This means that it has become more of a "credit picker's" market. With risk fairly efficiently priced, the game now is to select individual credits that will outperform based on fundamentals.
3rd party Ad. Not an offer or recommendation by Investing.com. See disclosure here or remove ads.
Which stock should you buy in your very next trade?
AI computing powers are changing the stock market. Investing.com's ProPicks AI includes 6 winning stock portfolios chosen by our advanced AI. In 2024 alone, ProPicks AI identified 2 stocks that surged over 150%, 4 additional stocks that leaped over 30%, and 3 more that climbed over 25%. Which stock will be the next to soar?
Unlock ProPicks AI