Trading session on Thursday was characterized by a significant weakening of the US dollar. Quotes of EUR/USD and GBP/USD pairs managed to push up from the area of the current year's minimum prices. The main reasons for this scenario were reports of Brexit progress and an increase in risk appetite. The leading stock indices in the Asia-Pacific region continue to regain the losses of the previous days. Today, the markets of this region showed an increase of 2.5-3.8%. In addition, the further weakening of the dollar against the Chinese yuan is an indicator of growth of optimisms. Pushing off from the maximum level in the area of 6.9757, the USD / CNY pair is on Friday morning around 6.9070.
However, the emerging optimistic picture has a number of irregularities that do not allow us to unequivocally assert that the dollar is weakening. On the one hand, the technical picture of the EUR / USD and GBP / USD pairs indicates the formation of the “double bottom” figure on daily timeframes. In addition, according to the results of yesterday's trading, the pattern of the candlestick analysis “bullish absorption” was fixed, which indicates the continuation of the positive dynamics of quotations.
However, on the other hand, I am confused by several circumstances. First, there was no update of the minimum prices of the current year. Quotes almost came to these values, but the lows have not been updated, which does not give a pure convergence signal. Secondly, important statistics on the US labor market is being published today, which can reverse the happy picture for bears on the US dollar. Thirdly, world markets are experiencing a rapid decline in the quotations of oil contracts, which is a negative point for commodity currencies and for the British pound. As noted in yesterday’s overview, it is the trades in the last days of the week that must either confirm or refute the dollar reversal. We continue to monitor the dynamics of quotations.
Today, the rate of weakening of the US dollar will noticeably decrease. After yesterday's rally in the markets, market participants will prefer to take a waiting position in anticipation of the publication of a report on the US labor market. Particular attention will be focused on the dynamics of NFP and average hourly wages.
EUR/USD
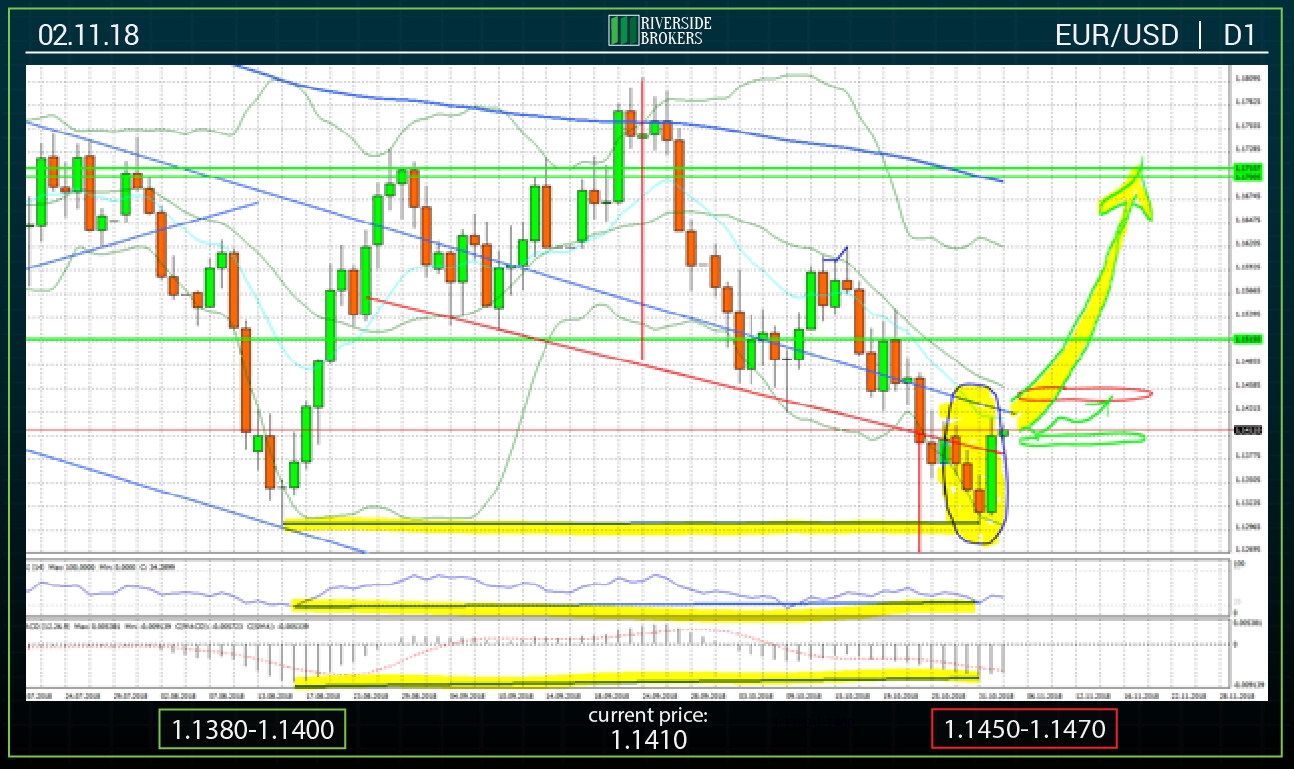
In today's review, the EUR/USD pair quotes chart is presented on a daily time frame. As can be seen from the chart, prices pushed off from the area of annual minimums, which led to the formation of the “double bottom” figure. In addition, the daily candlestick drawn a bullish takeover, which suggests a continued growth of quotations (yellow oval on the chart). In addition, a yellow color marker indicates convergence between price minima and the corresponding values of RSI and MACD indicators. However, it is worth noting that this signal is not entirely correct, since the annual minimums have not been updated. Today’s day can confirm or call into question the market reversal. The data on the US labor market will have a significant impact. In the case of confirmation of a reversal, the medium-term goal of the increase is the area of 1.1700-1.1710 (large yellow arrow).
Support and resistance zones today are in areas 1.1380-1.1400 and 1.1450-1.1470, respectively. At the same time, it is worth bearing in mind that the upper limit of the medium-term downward channel passes through the area 1.1430-1.1440, in which the pair has been trading since the beginning of May of the current year, which may become a local obstacle to the continued growth of quotations.
GBP/USD
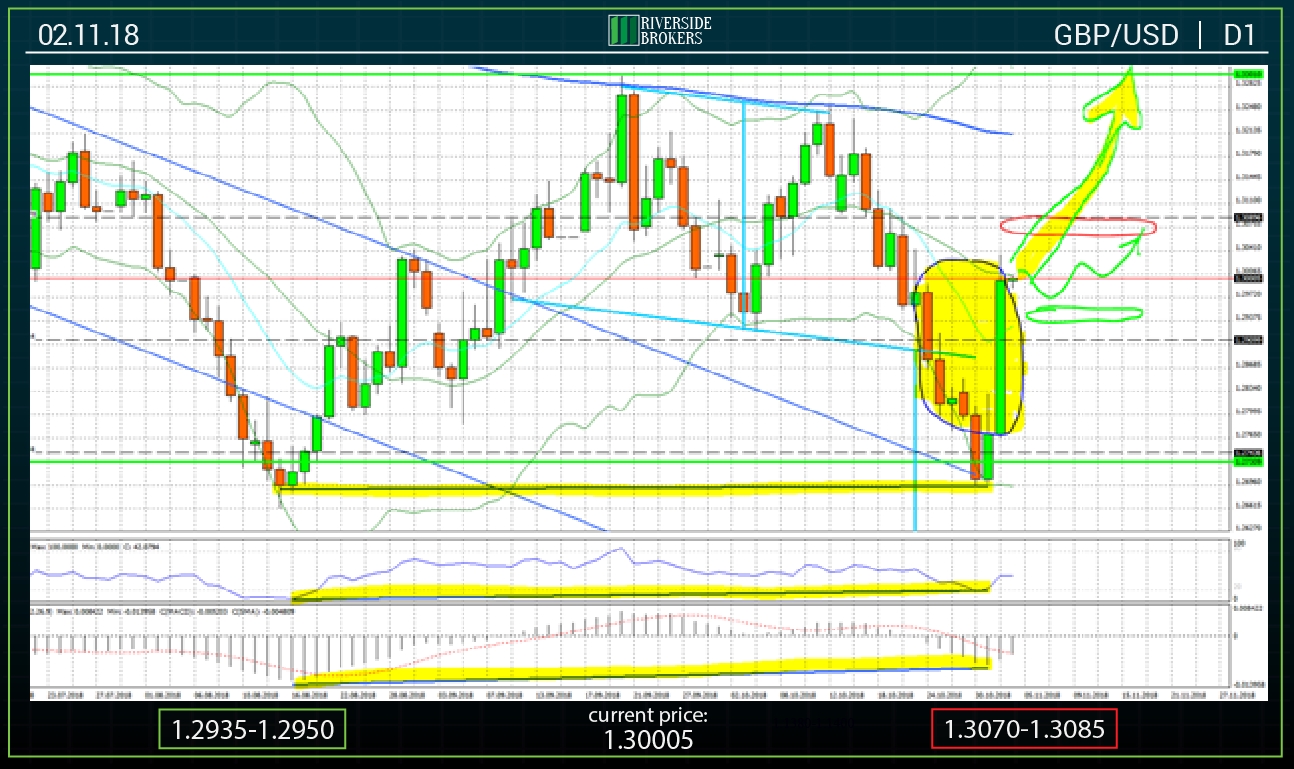
The technical picture of the GBP/USD pair is identical to the situation in the EUR/USD pair. On the GBP / USD D1 chart, the formation of a “double bottom” pattern and a “bullish absorption” pattern are observed. On Thursday, against the background of news about the possibility of an early signing of the Brexit Agreement, the quotes showed a real rally, increasing by the end of trading by almost 250 points. On Friday morning, prices are just above the 1.3000-mark, accumulating strength for a subsequent upward leap. At the same time, it is worth noting that a negative point for the British currency is a significant reduction in the cost of oil contracts, since historically there has been a high correlation between the market value of a pound and oil prices.
The final conclusion about the probability of further strengthening of the British pound against the dollar can be made only by the end of today's trading, after the publication of data on the US labor market. In case of a positive response, the medium-term growth target is 1.3300 (this scenario is marked by a yellow arrow on the chart).
The support zone is currently in the area of 1.2935-1.2950 (green oval).
The resistance zone is in the range 1.3070-1.3085 (red oval).
Today, before the publication of data on the labor market in the United States, the situation in the pair USD / JPY will not experience significant changes. Quotes will be in the side channel, the lower limit of which is the 200-period MA on the H4 time frame near the mark 112.50. The upper limit is still in the area of maximum prices October 8-10, 113.10-113.25. Depending on the actual values of the NFP indicators and the average hourly wage in the market, there may be strong price movements that will bring the pair's quotes outside the specified range. In case of strong statistics, prices may return to the level of 113.50. Otherwise, the quotes will drop to the level of 112.00.
The local support zone today is the range of 112.45-112.60 (green oval).
The zone of resistance is located in the area 113.10-113.25 (red oval).
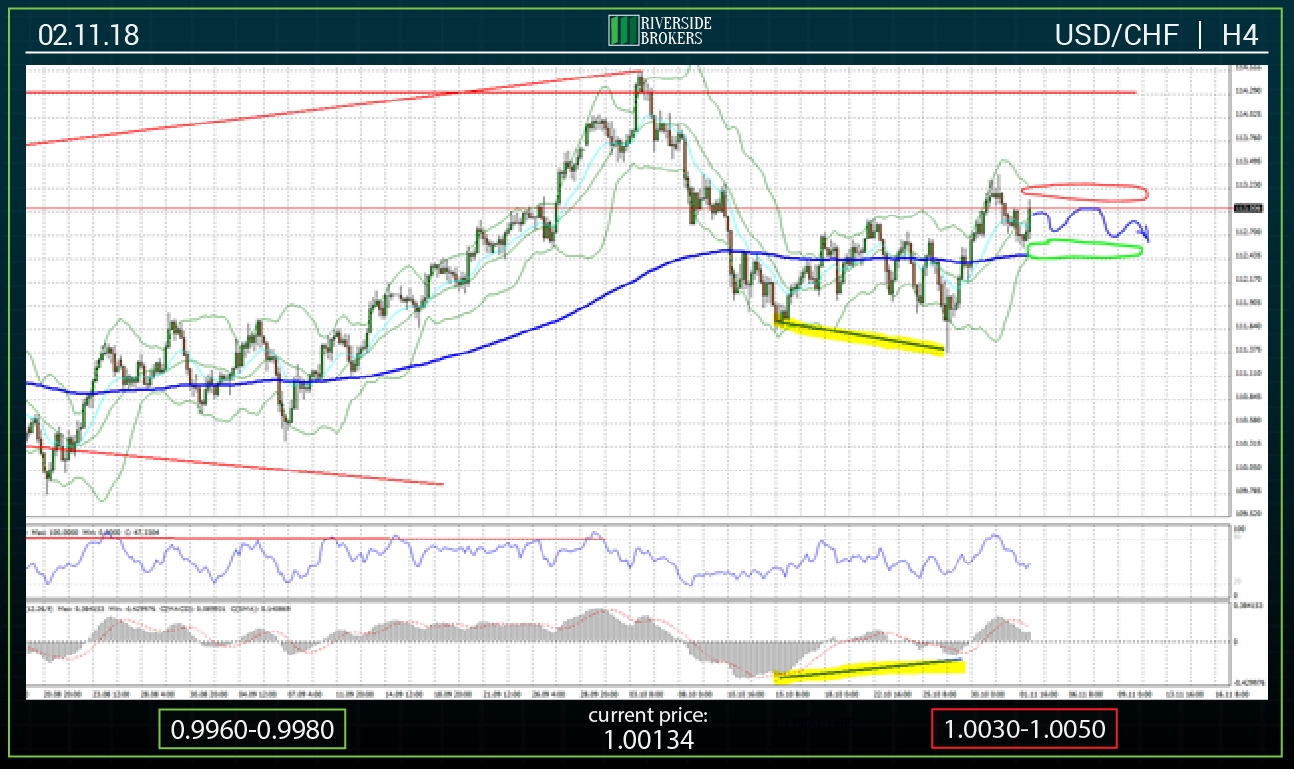
After a long period of growth of the USD/CHF pair quotes, the beginning of the negative dynamics was observed yesterday. The possibility of such a development was indicated by the contradiction between price dynamics and the technical picture that was repeatedly noted in previous overviews, which indicated a divergence between local price maxima and the corresponding MACD values.
On Thursday, the pair came close to the area of parity. On the attached chart, the red line marks the upper limit of the multi-year downward channel, which originates from November 2015, indicating its importance.
Today, before the publication of data on the labor market in the United States, quotes will fluctuate in the immediate vicinity of this border. In the late afternoon, prices may drop slightly to the support area located in the area of 0.9960-0.9980.
Support and resistance zones are located in areas 0.9960-0.9980 (green oval) and 1.0030-1.0050 (red oval), respectively.
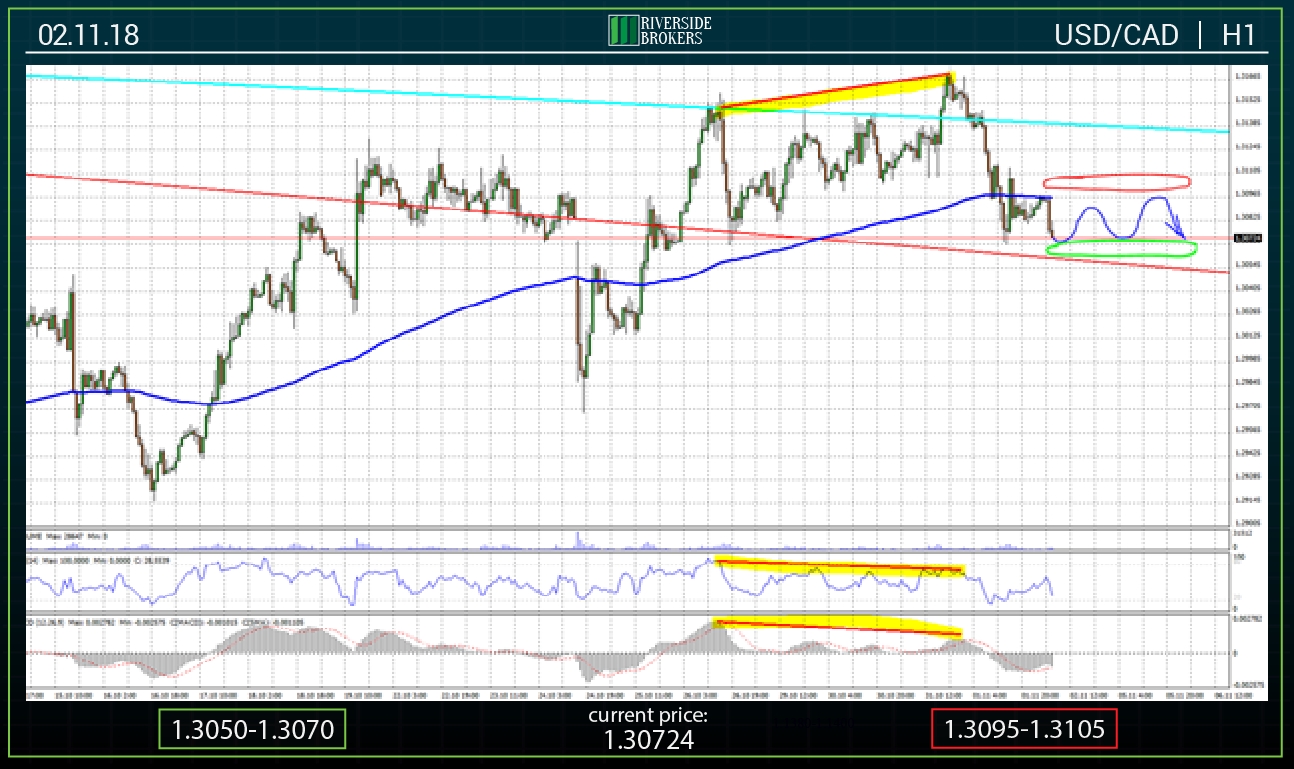
Yesterday's weakening of the US dollar in world markets led to a return of the USD/CAD quotes to the area below 1.3100. Thus, the implementation of the correction signal occurred - a divergence between the highs of prices and the corresponding values of the RSI and MACD indicators, the presence of which was mentioned in the yesterday's overview.
Today, until late afternoon, the prevalence of lateral dynamics is predicted. At the same time, at 15:30 Moscow time, there are data on the labor market in the United States and a similar report on the labor market in Canada. Published statistics can lead to significant movement of quotations. Depending on the actual values of the indicators, prices may rise to the level of 1.3100 or decrease to the level of 1.3000.
The local support zone is in the range of 1.3050-1.3070 (green oval).
Resistance is located at 1.3095-1.3105 (red oval).
Gold
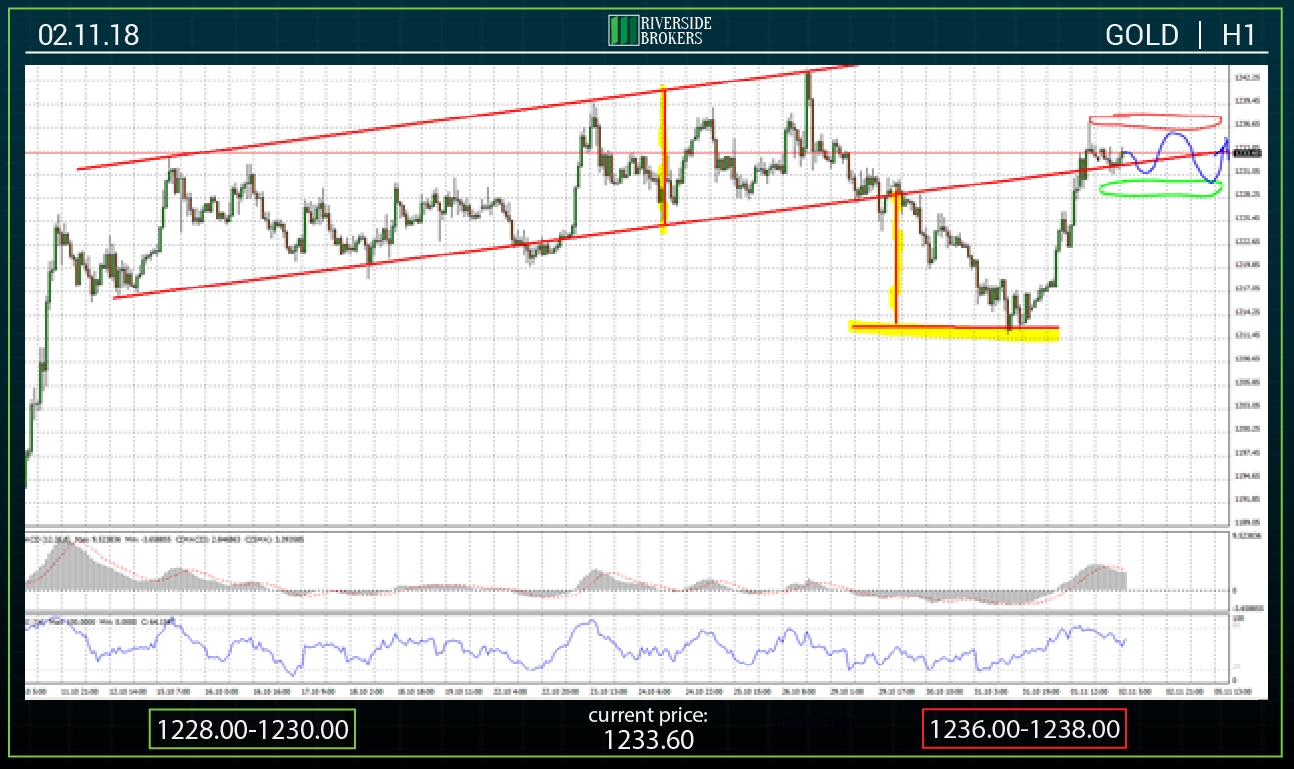
On Thursday, the positive dynamics of gold prices continued. After working out the reduction target around 1212.00-1213.00, prices showed an impressive increase and returned to the inner area of the medium-term channel, reaching 1234.00 by the end of the day. Today, a decrease in growth rates is projected. Quotes will move along the lower boundary of the channel located in the area of 1230.00.
The support zone is located in the area of 1228.00-1230.00 (green oval).
Resistance is the range of 1236.00-1238.00 (red oval).
Which stock should you buy in your very next trade?
With valuations skyrocketing in 2024, many investors are uneasy putting more money into stocks. Unsure where to invest next? Get access to our proven portfolios and discover high-potential opportunities.
In 2024 alone, ProPicks AI identified 2 stocks that surged over 150%, 4 additional stocks that leaped over 30%, and 3 more that climbed over 25%. That's an impressive track record.
With portfolios tailored for Dow stocks, S&P stocks, Tech stocks, and Mid Cap stocks, you can explore various wealth-building strategies.

