💵 What you need to know about the Fed interest rate decisionAsk WarrenAI

The Dangers Of Falling Prey To The Consensus

Published 04/28/2014, 01:38 AM

Often times the difficult aspect of writing blog commentary is posting articles that are interesting to investors and, more importantly, not a repeat of the commentary written by others. At times some of the same topics are repeated on the web during a given week where each article provides no new insight to readers. The repeating of similar topics begins to give investors the sense that a consensus view is developing. And one factor we know about the market is it likes to prove the consensus wrong. A good example of this fact is displayed when looking back at prognosticators' predictions at the beginning of the year. Most predictions were of the general theme that stocks would outperform bonds, but as the below chart shows, bonds have actually outperformed stocks. So what is the point?
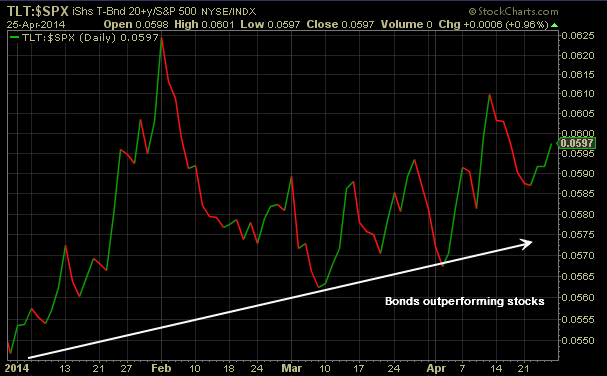
TLT-SPX

A theme currently getting a great deal of attention is the "sell in May and go away" topic. Even we have written about this seasonal market factor a number of times, as recently as mid-March. The importance of this theme is best explained by the below chart.
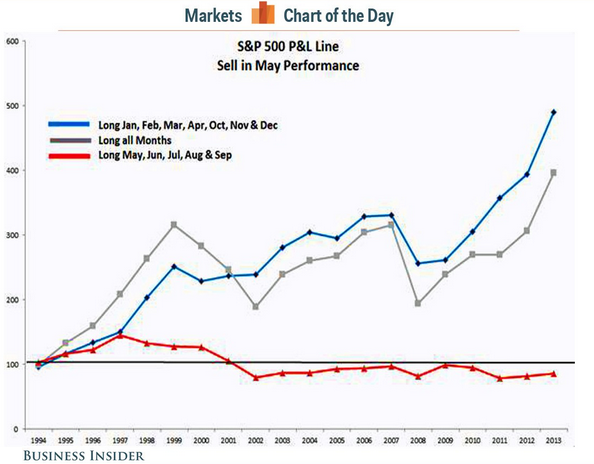
S&P 500

The chart certainly speaks for itself; however, Jeff Miller, PhD, who writes commentary on his A Dash of Insight Blog, notes,
"The seasonal slogans often substitute for thinking and analysis. The powerful-looking chart...actually translates into a 1% monthly difference in performance. The "good months" gain 1.3% on average while the "bad months" gain about 0.3% (emphasis added).

To make a wise decision you need to make an objective quantitative comparison between the economic trends and the small seasonal impact. The Great Recession has been followed by a slow and plodding recovery. We have an extended business cycle with plenty of central bank support. Since I am expecting the current cycle to feature (eventually) a period of robust growth, I do not want to miss it. The 1% seasonal effect will be minor in a month where we get a real economic surge."
3rd party Ad. Not an offer or recommendation by Investing.com. See disclosure here or remove ads.
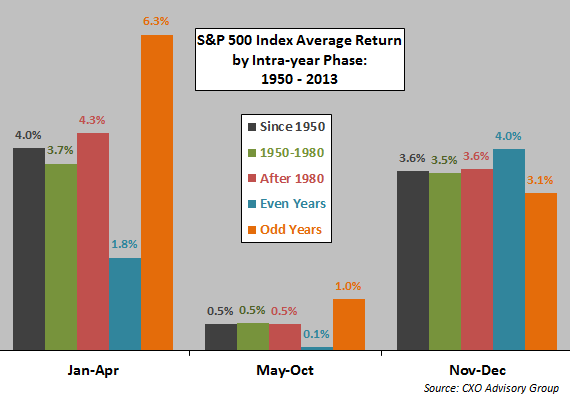
The next chart displays the previous chart data in a different way. In an effort to visualize Jeff Miller's comment, "...I do not want to miss it. The 1% seasonal effect will be minor in a month where we get a real economic surge," the below chart shows average returns for various time periods going back to 1950. The take away from the below chart is the fact, even as bad as the May to October period can be, on average, the returns remain positive.
S&P 500
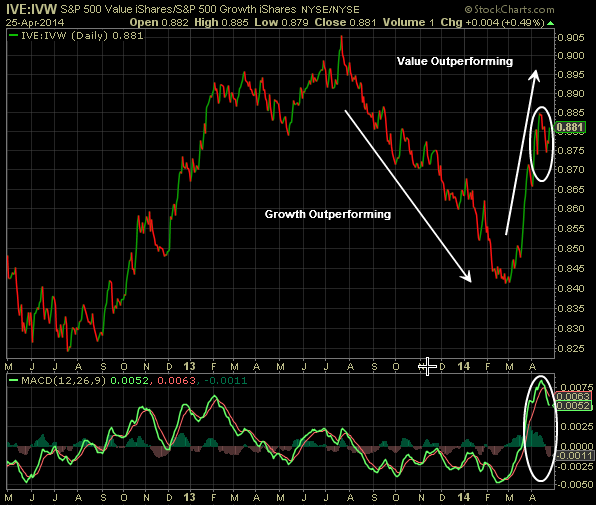
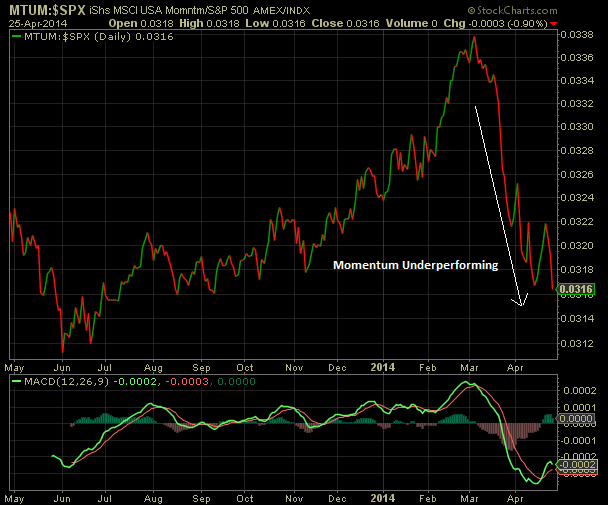
Another consensus discussion has been the rotation trade out of growth stocks into value stocks. The below chart reflects the fact value has been outperforming growth since the beginning of March. Importantly for investors, why is or has this occurred. The value style tends to outperform growth late in the economic cycle. In reviewing the technical aspects of the chart, there may be reasons to believe this trade is nearing a trend reversal. As the circle at the end of the chart notes, over the course of the last few weeks value is actually struggling to outperform growth with the MACD rolling over as well. The second chart below shows the momentum index (MTUM) performance versus the broader S&P 500 Index. Is a trend reversal taking shape here too? When I read commentary like this, OUT, I am led to believe a trend change is closer to occurring than not.
IVE-IVW
MTUM-SPX
3rd party Ad. Not an offer or recommendation by Investing.com. See disclosure here or remove ads.
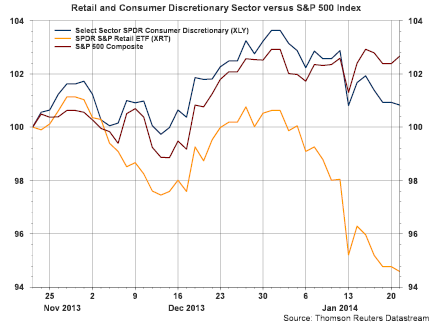
 A discussion on the weather's impact on first quarter results also seems appropriate too. Many first quarter reports have cited weather as a factor in negatively impacting first quarter results for companies. One segment of the market that reasonably can be thought to have been negatively influenced by the weather is retail. In our blog post in mid January, Broader Implications Of A Weakening Retail Sector, the below chart was included in the post showing the significant underperformance of the retail sector from the end of November to mid January.
Retail and consumer Discretionary Sector vs. S&P 500
In that post we highlighted a couple of points.
  • "if the pervasive market sentiment is the consumer has rolled over, vis-à-vis the market and the economy, the efficient market hypothesis would imply this type of news is factored into current stock prices."
  • "The weaknesses in some consumer stocks is certainly worth paying attention to; however, the market/investor already knows a lot about this weakness and a majority of this bad news may be factored into stock prices [emphasis added]."
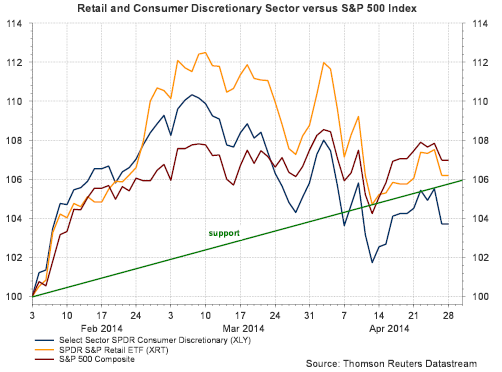
How has the retail sector performed since that January post? It has essentially tracked the market and has generated a return in excess of 6% as can be seen in the below chart.
Retail and Consumer Discretionary Sector vs. S&P 500
Importantly for investors, when a trend becomes evident the positive or negative results from the given trend may be mostly played out. At the end of the day, fundamentals are an important driver of the market's longer term movement. With this said, earnings season is in full reporting mode and results are generally positive. Some highlights from Reuters:
  • Second-quarter outlooks for S&P 500 companies so far are much more optimistic than the last two quarters. Fewer companies are cutting estimates and those that are reducing forecasts haven't done so as aggressively as in the past.
  • "The downward revisions for the second quarter right now are very, very mild," said Nick Raich, chief executive officer of The Earnings Scout, an independent research firm specializing in earnings trends."
  • Surprisingly strong results have come from many high-profile names, including Apple , Caterpillar , Netflix and United Technologies . That's offset what Wall Street had expected to be a lackluster first quarter. Estimates were slashed, heading into this earnings period as the unusually harsh winter hampered transportation, kept people out of stores and raised heating costs.
  • So far, 69 percent of companies have beaten analysts' expectations, above the long-term average of 63 percent, Thomson Reuters data showed.
  • Helping to relieve concerns, United Technologies, Coca-Cola , General Motors and McDonald's all reported strong results from their China operations. That's negated one of the market's primary worries that weak demand from the world's second-largest economy would hit profits. "It is still a little surprising how strong China remains, given what you read," United Technologies' Chief Financial Officer Greg Hayes said in an interview, in reference to the conglomerate's building systems businesses.
 
So to rephrase Jeff Miller's comment, do not let the consensus and "...seasonal slogans substitute for thinking and analysis."
3rd party Ad. Not an offer or recommendation by Investing.com. See disclosure here or remove ads.

Which stock should you buy in your very next trade?

AI computing powers are changing the stock market. Investing.com's ProPicks AI includes 6 winning stock portfolios chosen by our advanced AI. In 2024 alone, ProPicks AI identified 2 stocks that surged over 150%, 4 additional stocks that leaped over 30%, and 3 more that climbed over 25%. Which stock will be the next to soar?

Unlock ProPicks AI

Latest comments

Loading next article…
Risk Disclosure: Trading in financial instruments and/or cryptocurrencies involves high risks including the risk of losing some, or all, of your investment amount, and may not be suitable for all investors. Prices of cryptocurrencies are extremely volatile and may be affected by external factors such as financial, regulatory or political events. Trading on margin increases the financial risks.
Before deciding to trade in financial instrument or cryptocurrencies you should be fully informed of the risks and costs associated with trading the financial markets, carefully consider your investment objectives, level of experience, and risk appetite, and seek professional advice where needed.
Fusion Media would like to remind you that the data contained in this website is not necessarily real-time nor accurate. The data and prices on the website are not necessarily provided by any market or exchange, but may be provided by market makers, and so prices may not be accurate and may differ from the actual price at any given market, meaning prices are indicative and not appropriate for trading purposes. Fusion Media and any provider of the data contained in this website will not accept liability for any loss or damage as a result of your trading, or your reliance on the information contained within this website.
It is prohibited to use, store, reproduce, display, modify, transmit or distribute the data contained in this website without the explicit prior written permission of Fusion Media and/or the data provider. All intellectual property rights are reserved by the providers and/or the exchange providing the data contained in this website.
Fusion Media may be compensated by the advertisers that appear on the website, based on your interaction with the advertisements or advertisers.
© 2007-2025 - Fusion Media Limited. All Rights Reserved.