Nvidia to resume H20 chip sales in China, announces new processor
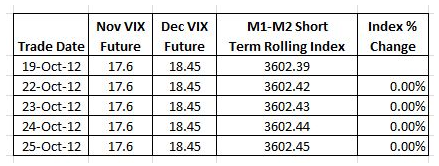
A while back I developed a spreadsheet that consolidates the CBOE’s historic VIX futures data into a single spreadsheet. Using this spreadsheet I calculate the short (SPVXSTR) and medium term (SPVXMTR) rolling indexes that underlie the various volatility Exchange Traded Products (ETP) like VXX, UVXY, XIV, and ZIV The image below shows a small sample comparing my calculations (M1-M2 Short Term Rolling Index) with the official value of the short term index.
The percentage differences between my index and the official index (e.g, -0.000256%) aren’t cumulative and are probably due to rounding.
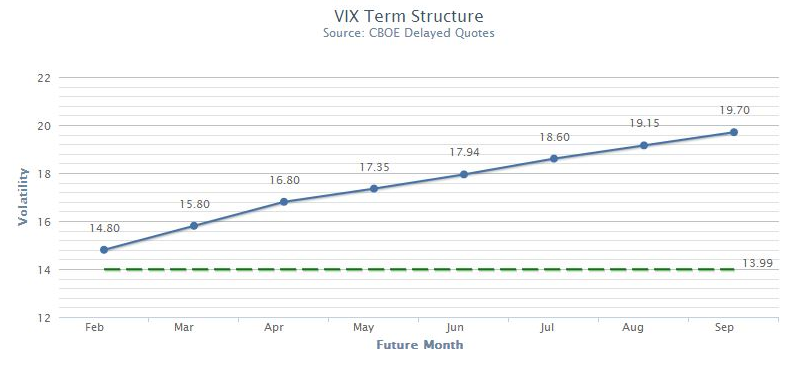
Once I had verified my index calculations I wanted to look at the nemesis of the long volatility funds like VXX and UVXY—yield losses. These losses, which can be 5% to 10% per month occur when the CBOE S&P 500 Volatility Index (VIX) Futures that underlie these ETPs are more expensive for longer dated contracts compared to the shorter term contracts. This situation is called contango, and is typical when the overall market is bullish or flat. The graph below from VIX Central shows VIX Futures in a contango configuration. 
I wanted to quantify this loss with my spreadsheet without the noise of everyday volatility moves, so I left the term structure in contango, but held the futures prices constant in my spreadsheet from day to day as an experiment. The results were surprising.
My calculations showed no daily roll costs in the index. The 0.01 upticks in the index are due to treasury bill interest.
The usual explanation for roll costs, discredited in the sample above, asserts that losses are incurred when funds sell cheaper shorter term contracts and buy more expensive longer term contracts every day as specified by the indexes they follow—a sell low, buy high situation. A closer look illustrates the flaw in this explanation. A simple example of a $10 million position after market close on 19-Oct-12— after the contract rolls. Fractional contracts aren’t supported, so unused money goes in the cash bucket.
Now moving to the end of the next day, neglecting transaction costs and interest, and assuming no change in the futures values.
The number of contracts changes, but the total value doesn’t.
There’s no doubt that these indexes lose money when the VIX Futures term structure is in contango—so where do the losses come from?
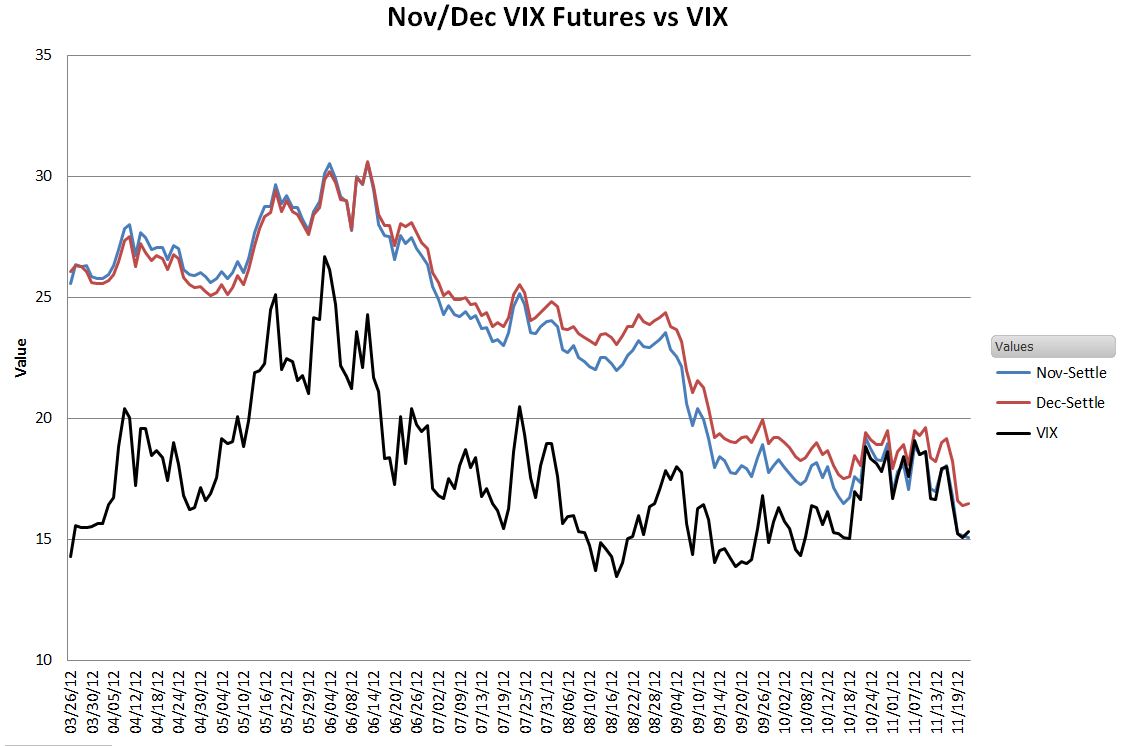
The chart below shows the real root cause:
Plotting actual November and December VIX futures values during a period of contango vs the CBOE’s VIX®, we see that both contracts decline in value over time, eventually converging with the “spot” VIX price at their expiration. With both sets of contracts held by the long volatility funds generally declining it’s not surprising the overall value drops. Since we are typically looking at term structures over the span of multiple months, the small daily “slide” down the curve isn’t noticeable—especially when obscured by the up and down moves in volatility driven by daily stock market fluctuations.
This analysis also explains why the mid-term volatility index SPVXMTR which holds contracts that are 4 to 7 months out also declines rapidly in contango situations, even though 2/3rds of the contracts (M5 & M6) aren’t rolled on a day to day basis.
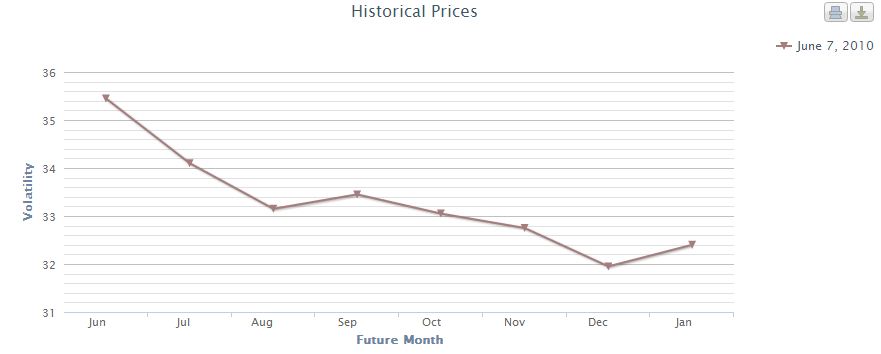
Volatility Futures aren’t always in contango. If the markets are panicky enough the short term contracts get more expensive than the longer term ones. The chart below, from VIX Central shows the June 10, 2010 situation. 
In this configuration, called backwardation. the long volatility funds have the wind at their backs, every day the futures they hold are sliding up the curve, getting closer to the spot price.
Knowing the real reason for term structure based losses / gains hasn’t changed my volatility investment strategy, but it has removed one source of confusion in understanding the daily moves.
Which stock should you buy in your very next trade?
With valuations skyrocketing in 2024, many investors are uneasy putting more money into stocks. Unsure where to invest next? Get access to our proven portfolios and discover high-potential opportunities.
In 2024 alone, ProPicks AI identified 2 stocks that surged over 150%, 4 additional stocks that leaped over 30%, and 3 more that climbed over 25%. That's an impressive track record.
With portfolios tailored for Dow stocks, S&P stocks, Tech stocks, and Mid Cap stocks, you can explore various wealth-building strategies.
