Grok 4 is here and analyst says ’don’t bet against Elon’
For the last couple of months we have been writing about the potential for a correction. That correction, up until now, has remained elusive for a variety of reasons from the ECB's liquidity injections, psychology, performance chasing and low participation in terms of volume. However, as we have stated previously, "reversions to the mean", or moving averages, always occur. It is this simple reality that is continually disregarded by the mainstream chatter that continually leads investors to buying high and selling low.
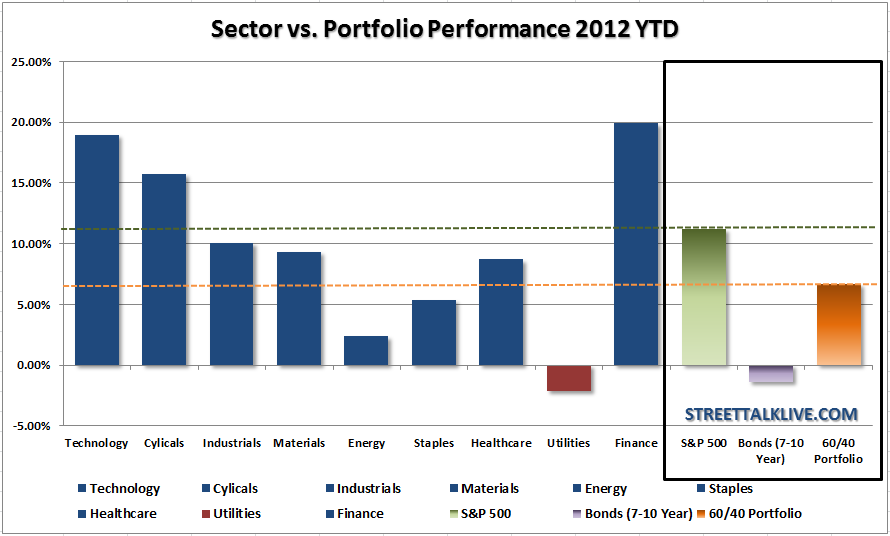
As I wrote in this past weekend's newsletter:"The chart shows the performance differences in each of the major S&P 500 sectors and the market itself, bonds and a 60/40 allocation model. As you can see the only way to have outperformed the broad market this year so far was to be narrowly diversified between arguably the three most risky sectors of the market (finance, technology and cyclicals). THIS WILL CHANGE BEFORE THE YEAR IS OVER. Those that are heavily exposed to risk will suffer a severe rout between this missive and the end of the year. Bonds will pick up performance and stocks will lose." 
The reason I made that statement was simply because of the effect that would be created by a reversion to the mean. When you have very narrowly defined advances they are dangerous in their own right. However, when you have one stock in particular (AAPL) which is driving a large portion of the entire market gain – the risk profile has risen substantially. With this in mind, a reversion to, and potentially beyond, the mean reduce the overall risk of investing in the market. The question is what level would that be?
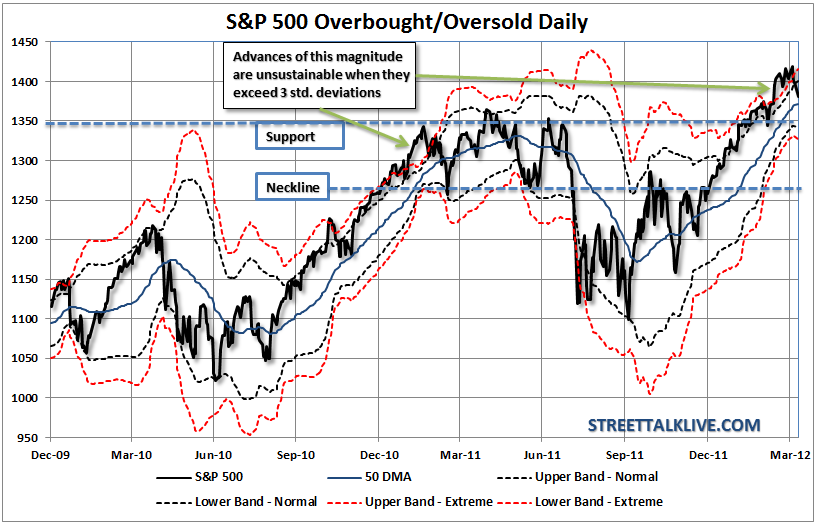
To answer that question we need to understand that advances of the magnitude that we have witnessed in the first quarter are not unique. The differences lie behind what is driving them. Liquidity driven advances that we witnessed in 2010, 2011 and 2012 have all met the same demise as liquidity ran its course. The chart shows the market with 2 and 3 standard deviations from the 50 day moving average (dma).In the previous corrections in 2010 and 2011 both reverted to a minimum of 2 standard deviations below the 50 dma. Currently, that would be a correction of the S&P 500 index to roughly 1350 as long as, and this is key, that we stay within the context of a bullish, upward, trend.Should the bullish trend reverse, as it did last summer, then the analysis changes.
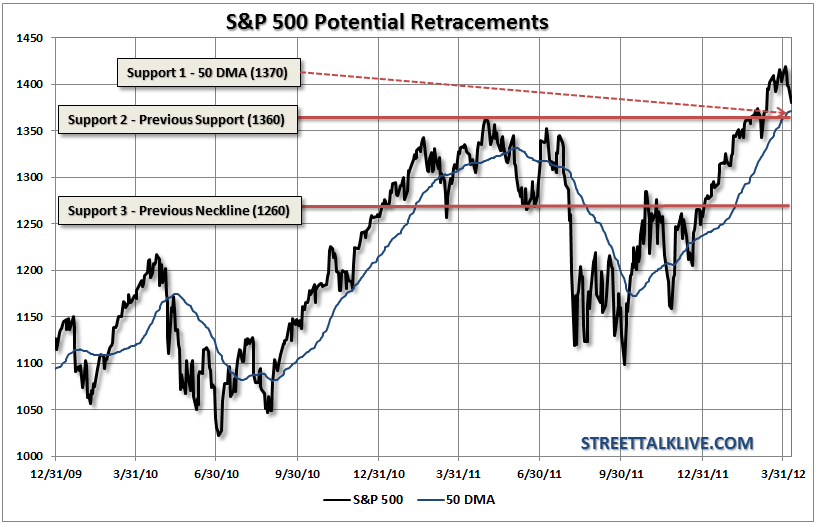
With this idea of mean reversion in mind we also have to look at the technical supports of the market given the fact that currently we are in a bullish trend. The rules of a bullish trend are simple:"buy dips." The important part here is trying to distinguish the context of how large a "dip" might be. The next chart identifies the two most logical areas of near term support as well as the "line in the sand" that we must not cross.
The markets should find initial support at the 50 dma, which as of the time of this writing is 1371.30 to be exact. Over the next day or so this will likely be closer to 1370 as identified in the chart. Just behind that is the April 2011 closing high which should act as the next level of support at 1360ish. If the markets are going to remain within the confines of a bullish trend it is critically important that these levels hold. A pullback and some consolidation will allow for the overbought condition of the market to dissipate and allow for a lower risk entry into equity investments.
Bonds and Gold Rally
Over the last 3 weeks we have been discussing that the correction in bonds and gold were providing excellent entry points to add exposure as they would act as a hedge to the anticipated equity market correction. Today with gold surging and interest rates plummeting the added exposure will reduce losses in equity holdings.
As we wrote in "Death Of The Gold Bull Market" the recent calls for the death of precious metals has been greatly exaggerated. The "fear trade" remains alive and well and will remain so as long as there is economic uncertainty. Unfortunately, the certainty of economic uncertainty remains high given the geopolitical, economic and financial backdrops that currently engulf the globe.
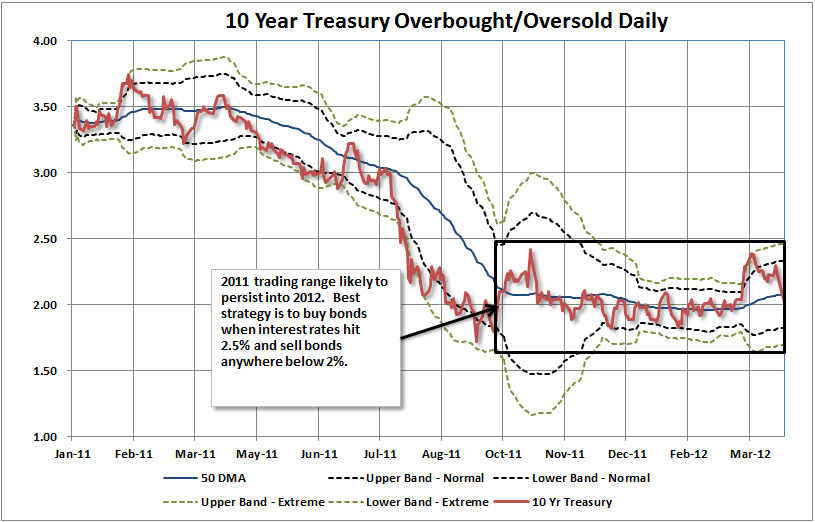
The same concept runs true for bonds which has remained a "safe haven" for investors as witnessed by the continued inflows into bond funds by retail investors versus equity funds over the past couple of years. The chart of the 10-year treasury rate was first produced in our weekly newsletter last October. The trading range, as predicted, has remained well in tact over the last several months despite calls for the end of the "bond bull market". The best buying opportunities have come when interest rates have risen towards the 2.5% range on the 10-year causing bond prices overall to decline.
There is no reason for this trading range to breakout to the upside anytime soon particularly as we head into the next debt ceiling fiasco by September and the elections this coming November. Bonds and gold will remain strong hedges against the highly volatile markets particularly if we see a resurgence this summer of economic weakness as the seasonal weather patterns realign themselves with the seasonal adjustment factors used in economic reporting.
Bullish Trend In Tact But Summer Approaches
Currently the bullish trend is in tact which means that at the current time we still need to buy dips. This has been the case since our buy signal back in October of 2011 and then confirmed in late December. However, we are now rapidly approaching the end of the seasonally strong time of the year which tends to mark the end of bullish advances.
As we stated this past weekend: "This is not an absolute prediction but a possible outcome based on weakening profit margins, employment and potential for a resurgence of both the debt crisis in Europe and another debate surrounding raising the debt ceiling prior to the election. Oh, and the election itself." The headwinds that are mounting currently limit further advances in an already very overbought and liquidity driven market.
The correction last week, the employment report on Friday and today's decline have all brought forth the trumpeted calls for more easing. While there is hope that the Fed will once again come to the assistance of Wall Street the negative impacts to Main Street through higher inflationary costs are an overriding concern by the Fed. With core inflation already running well into the upper end of the Fed's target range there is little room for the Fed to aggressively act monetarily. While the market so far has responded positively to the Fed's innuendos and suggestions there will come a point in time where inaction will have a consequence.
Currently, the bullish trend is still intact. However, realize that the trend can change very quickly as we witnessed last summer. If the current bullish trend ends then there will be plenty of time to rebalance portfolios and reduce exposure accordingly. Likewise, if this is simply just a "dip" that leads to short term oversold condition then allocations can be increased accordingly. However, the worst thing that you can do as an investor, is to make portfolio movements based on assumptions and volatile market movements. Smoothing the daily market movements with weekly analysis smooths out the day to day volatilty and helps reduce costly emotional mistakes. Slow and steady wins the race both in life and in investing.
Which stock should you buy in your very next trade?
AI computing powers are changing the stock market. Investing.com's ProPicks AI includes 6 winning stock portfolios chosen by our advanced AI. In 2024 alone, ProPicks AI identified 2 stocks that surged over 150%, 4 additional stocks that leaped over 30%, and 3 more that climbed over 25%. Which stock will be the next to soar?
Unlock ProPicks AI