Morgan Stanley identifies next wave of AI-linked "alpha"
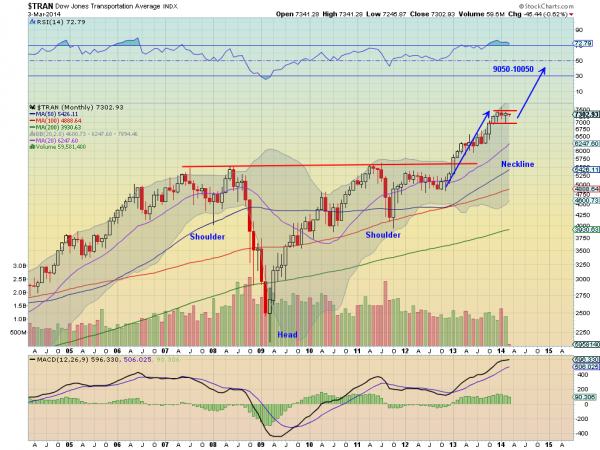
The close of the month is a good time to take a broader perspective on the markets. If you do that with the Dow Jones Transportation Average Index (DJT) there are three guiding characteristics that you need to watch to stay on the right side of the market in transportation stocks. Everyone is familiar with the head-and-shoulders pattern, which is present in the Transports, albeit upside down. The monthly chart below shows the pattern with the neckline at about the 5600 level. What is important to know about this technical pattern is that it looks for a move up to 9050 at least (you get there from measuring the distance from the tip of the head to the neckline then adding it to the neckline higher). That still leaves a long way to go to the upside.
The second point is what's known as a 'measured move', which is technical jargon used to describe that the move in Transports on the blue arrow added again to the consolidation over the last few months would target a level of 10050 were it to happen again. Trust me, these types of symmetrical moves do happen often. This would be in play on a move above the consolidation zone, over 7500.
The third concept to understand is that the first two are not guarantees. That means that the Transports may not reach those levels, but it also means that it could reverse and move lower. That is the more interesting scenario. And a move below the red consolidation zone, below 7000 is a signal to reverse course and look lower. That would give two immediate targets: 6250 and then the Neckline at 5650. Clean and simple. Use it as a guide for the transportation ETF (IYT) or for your transportation stocks.

